| |

"It's
Our Fault" | Doubts |
Did Gore Lie? | Emperors
New Clothes | Temp
| -records | -distorted.
| IPCC vs Science | CO2
basics | Corruption?
Heart of the controversy |
Cosmic Rays | Solar
Driver | Key Science |
CO2
follows temp | No Runaway
Temp | CO2 Lynching | Truth
of CO2 cycle Missing MWP |
Hockey Stick | Scientific
Malpractice | Urban
Heat Islands | False Alarms |
Face the Problem |
Solutions? |
Summaries |
Glossary
Introduction
Perusal of "obvious" evidence and "scientists'
reports" converted many people from being sceptical of
Anthropogenic Global Warming, to believing it was true - this
happened to me, watching Al Gore's film. However, further
perusal of "neglected" or "suppressed"
evidence leads to a U-turn back to an informed scepticism.
"Climategate", the public exposure of emails
confirming suspected malpractices in key areas of Climate
Science, and the whitewash "reviews", occurred after
I first wrote this, and amplified the public disillusion with
the official science. My Primer is a pretty unique "confessions
of an ex-warmist" aimed at intelligent non-scientists
as well as scientists from other disciplines, not too long/erudite
nor too short/simplistic.
This is a personal story of awakening, as well as a primer
in Climate Science. It is not officially "peer-reviewed",
but it has had excellent unofficial peer-reviewing from both
supporters and critics. It works from a lot of muddy, confusing
evidence, to gain clarity in the science, so that effectively
one becomes a scientist as one progresses with reading
this and thinking about it. Thus you can reach your own informed
conclusions about the science as well as the politics. You
are protected from hitting a brick wall of technical language,
or paywalls, or contradictory reports without clues. It is
vital to grasp the scientific basics, to see where
orthodoxy fails on science that has been taken for granted
and trusted. Checking contradictory sources, and
continuing to question evidence, is essential to discovering
the truth. The primer is loaded with references; but no amount
of good references is good enough for someone whose mind is
already made up. Nobody is sponsoring me.
If you cannot trust evidence unless
it comes from a top scientist with whom you cannot pull rank,
watch Professor Carter show how CO2 is not causing
Catastrophic Anthropogenic Global Warming (CAGW),
parts one,
two,
three
and four.
This fairly short, fact-packed, crystal-clear science U-tube
may be all you need. Back this up with more
videos. Look at the evidence
in Akasofu: Two
Natural Components of the Recent Climate Change
and Segalstad: Atmospheric
CO2 and Global Warming (both large pdf files).
Learn a overview of facts: Global
Warming Science is a powerful resource: good
science and good links. Discover IPCC's scientific
limitations with a top
solar scientist. Study the 850
Peer-Reviewed Papers supporting scepticism of
"Man-Made" Global Warming alarmism. Friendly
for non-scientists is a simple
introduction. Read the short but forthright Skeptics'
Handbook that clarifies the key issues for debate.
An introduction similar to this
one but written by a trained scientist, is
Great Global Warming Hoax. Statisticians show
the predicted hotspot is missing, though it is essential to
the CAGW hypothesis. A brilliant amateur disproves the two
basic CAGW hypotheses with Cause
and Effect. The NIPCC
is written by experts to match the contents, and beat the
expertise, of IPCC itself. Here is a whole list
of introductions. More exist. Read our quotes
from top scientists that include Nobel laureates.
Take your pick. Nobody can truthfully say that scientists
sceptical of manmade global warming are kooks or crooks, or
simply in the pay of Big Exxxx, or that there is a consensus
- as Al Gore claimed.
I have, throughout, tried to judge the science on its own
merits, not by whether it has been peer-reviewed and supported
by official science. This is an important point. There's a
lot of evidence that crucial work in Climate Science has been
refused publication in peer-reviewed science literature, not
because it's bad science but because it challenges "authority"
and vested interests. Climate Science is not the only area
of science to have this problem. The time for debate in Science
is never over. Important ideas always bubble up to
be explored, long before formal studies. Often even the experts
disagree. It is quite normal for important new work to be
rubbished at first. Since climate sceptics have been shut
out of mainstream publication and acceptance so extensively
and crucially (as Climategate shows), they have turned to
websites and blogs, to share more and more evidence that contradicts
"manmade global warming". If you have evidence to
query or improve anything here - please contact me. I've done
my best, but I'm still learning and I still make silly mistakes
sometimes.
Now we'll turn the clock back to before Climategate 17 Nov
2009, to tell my story.
*******************************************
I became
alarmed by seeing An Inconvenient Truth
In September 2007 I became very concerned about global warming
after seeing Al Gore's film An Inconvenient Truth.
He showed a graph which is a "hockey stick" shape,
showing a millennium of steady global temperatures, followed
by a dramatic temperature rise as the twentieth century progressed.
A second graph shows CO2 levels rising inexorably from 1958
when Keeling started CO2 measurements. Al Gore showed the
temperature "hockey stick" together with Keeling's
compelling zigzag graph, to demonstrate how the two had risen
together. He then showed disasters worldwide, including
Hurricane Katrina, which are all apparently getting worse
as temperatures rise. He said:
- "Our CO2 emissions were the
cause of the suddenly-rising CO2 levels, since
nothing natural could have caused this.
- And the rising CO2 must have caused
the recent alarming temperature rises, since,
again, there was nothing else natural."
A study by Naomi Oreskes showed that a complete
consensus of scientists were portraying a very
serious picture - threatening our whole future
- unless we drastically lower our carbon dioxide
emissions, and unless we act quickly. It seemed
that there was no serious scientific dissent from
the hypothesis of Catastrophic Anthropogenic Global
Warming.
|

|
|
The message was reinforced for me by top NASA scientist James
Hansen describing catastrophic levels of polar ice melt. I
always checked evidence - and my checks seemed to confirm
the science. As I lived on the Somerset levels, a huge area
as flat and low as Holland, the picture hit home. Holland
would disappear completely in this new Noah's Flood. How are
we to cut back CO2 soon enough? Cope with disaster? What are
we bequeathing our children? How can I begin to wake people
up?
That month, I changed from back-street thinker to 200% committed
activist. I discovered Transition Towns, which are developing
positive, creative ways to cope with Peak Oil and Global Warming.
I read many science websites, which all told me that those
who still denied we were causing Global Warming were ignorant,
in denial, or in the pay of big oil. I found clear answers
to all the sceptics' issues. I got to learn the chief sceptics'
names: who to counter, and how.

|
It
was all open to fair debate at well-regarded websites
like Skeptical
Science. Or so it seemed.
Then I heard a radio debate with Peter Taylor,
a scientist and environmentalist with an outstanding
track record with Greenpeace. He doubted the global
warming science, and I started to wonder. His
paper (now offline, see now his book Chill)
showed me there was serious room for doubt.
I started to look at evidence afresh. I found
the graph [left], standard data (click on pic
to explore what is "standard"), showing
that global temperatures have not risen
in the last decade, despite steadily rising CO2
levels. |
|
What's up doc?
temperatures falling despite CO2 rising..?
I noticed things in the climate forums that I'd passed over
before. I noticed unexplained anomalies in the most basic
data. IPCC (Intergovernmental Panel
for Climate Change) use the following graph showing global
temperature rise from 1860 to now. Their original bright red/blue
vertical bars are highly distracting, so I've toned them all
down to pale gray. When the powerful colours are removed,
it is much easier to see that the temperature also rises steeply
from 1910 to 1940 when CO2 output was far lower. One starts
looking without being spoon-fed. Ah yes, temperature decreases
from 1940 to 1970. So what was the meaning of the vertical
bars changing from "BLUE" to "RED" as
they cross a "zero" line? What zero? Why?
No convincing
explanations are offered for any of this by the
IPCC. Yet one would expect to find clear answers
to such obvious queries right at the top of all
the official FAQ's about Climate Change.
I realized that the zero line and the red-blue
bar colours have no meaning whatsoever scientifically...
... but psychologically the effect is vey powerful.
It distracts the eye from the anomalies
to the CO2 rise correlation, and it suggests the
rise will continue dramatically. It prepares the
mind... |
|
|
...for the splice of this 150 years' thermometer record onto
a millennium of "proxy" temperature measurements,
that produced the infamous "hockey stick".
This icon was used prominently by IPCC 2001. I started Googling for
evidence of other views - still trying to avoid the "baddies"
like Lord Monckton and the Heartland Institute who were in
the pay of "big oil"... I found this Gallup poll
- it is out of date - but was it true then, and is it true
now, that there wasn't the consensus among scientists that
Al Gore claimed when he made his film? Here's a 2006
poll... but it's from Heartland... oh dear... is it fair
or not?
|
Let's
just check that big global temperature rise
<-------
...where's it gone
recently?
I thought it was
rising...
...well, this is
what scientists have been saying isn't it?...
...what scientists? |
|
|
Help! but the nineties were the warmest years of last century?
What, 1930's were warmer... oh, in the US... but New York
has only got warmer now because it's a city... and oh my goodness,
it was even warmer, according to the oxygen isotope records,
in the Medieval Warm Period... even warmer in the Roman Warm
Period... even warmer in the Minoan Warm Period. Is there
other evidence for this? Roman remains under glaciers? Greenland
buildings buried in permafrost? well, yes...
Oh no! Al Gore
has portrayed a totally misleading picture!
Suddenly I mistrusted the whole of Al Gore's message in An
Inconvenient Truth. His claim of scientific consensus
over global warming now sounded false: I'd found reasonable-sounding
scientists who disagreed. It appeared that the "hockey
stick" graph he used could be false. He maintained that
CO2 is driving temperature change now, despite the
visible lack of correlation in the recent temperature / CO2
graph; then he insinuated that the geological records show
that CO2 has always driven temperature changes - yet you cannot
tell from his graphs which drives which, if at all, or whether
both have another driver. In fact, the records show that CO2
lags behind big temperature changes by around 800
years - but on a geological time scale, this lag is so small
that you don't see it unless you look close.
Gore made claims of "extreme weather" that will
happen as CO2 rises - accelerating sea level rise, more droughts
here, floods there, tornadoes, serious hurricanes (Katrina
was timely), glaciers melting, ice-sheets cracking up, the
Gulf Stream shutting down, heatwaves killing people, tropical
diseases spreading, lakes drying out, polar bears dying out...
all supposedly already happening and likely to getting worse
through our global warming. He calls carbon dioxide a pollutant.
In my new searches, however, I discovered that... every
single claim of An Inconvenient Truth is "cherrypicking",
false, or otherwise critically misleading...
...as has been
shown well in "35
Errors in AIT" by Lord Monckton, "Falsehoods
in Gore's AIT" by William Johnson, "Unmasking
AIT" by William Kininmonth, and "Convenient
Fibs" by Prof. Rossiter. Here's a short
video
of scientists challenging Al Gore. Check the evidence
yourself: don't bypass Monckton because you've
heard that he is untrustworthy, as I once did
(that's ad hominem and a great way to
avoid the truth).
Here was weighty, informed evidence on all counts
against Al Gore, that I could not refute - however
much I might try. Suddenly - there was a mass
of evidence that contradicts every single claim
for Catastrophic Anthropogenic Global Warming. |
|
|
The Emperor's New
Clothes
So was the Emperor of Global Warming naked? Everywhere I
now looked, I was seeing the evidence differently.
How could I have
been so mistaken? Was I really that mistaken?
How could Al Gore be so untruthful? How could
he have slipped through the checks and balances
of Science, if he really was that misled or twisted?
How could so many scientists be so mistaken? Perhaps,
if I looked harder, I'd find that science did
have answers? For a while I bounced from one side
to the other as challenge after challenge appeared.
But every time I dug deeper, I found more bad
science, more evidence that there was no CAGW.
So what does this say about those who have promoted
a misleading, expensive science where the prime
evidence disappears in every direction? Could
scientists say they had been deceived or pressured?
Did any experience a "Damascus" awakening?
How was I going to avoid being ignored or trashed
as a shill of "big oil", a gullible
newcomer, a heretic who "cannot deal with
the real science"? And how was I to channel
my distress and outrage in positive ways? How
was I to stand up for the truth with courtesy,
when I was uncovering what now looked like mass
hysteria, stupidity, ignorance, pretence, bullying,
and even fraud?
|
|
|
I started to discover I was not alone - I found articles
like "how
can so many be so wrong?" and "discrimination
& job loss" and "confessions
of an ex-IPCC reviewer" and "alarmist
tactics & funding" and "Wikipedia
disinformation" and "I
devoted six years to carbon accounting" and "The
Green Inquisition" and saddest of all "The
Lynching of CO2 - the Innocent Source of Life". And,
despite the official extreme reluctance to even mention these
information sources by name, lest - God forbid - I go and
look for myself, I found Watts
Up With That and Climate
Audit, and the gates were open to connect with like minds
both amateur and highly professional, and to explore for myself
the research that Al Gore had concealed and denigrated.

|
Michael Mann's
"Hockey Stick" graph was given great
prominence in IPCC 2001; it was used by Al Gore.
It shows temperature rising dramatically after
1000 years of supposedly little change. Note the
slight decline up to 1900 - more later. It denies
the very existence of the well-known Medieval
Warm Period - see here
(Monckton's 19 papers), here
(Loehle's study with non-dendro proxies) here
(CO2 Science), and here
(67-page paper).
The Hockey Stick was discredited by the Wegman
Report to the US Government in 2006 as having
"a validation skill not significantly different
from zero". |
|
Many scientists started out honestly believing
there was a serious greenhouse warming effect from rising
CO2 levels, and that the increase in CO2 levels was due to
us. But there is masses of evidence that does NOT fit CO2
raising temperature. And... CORRELATION DOES NOT PROVE CAUSATION
OR EVEN CONNECTION.
Let's look at the
evidence for ourselves...
We can make wise choices instead of uncertain and expensive
choices which depend on small teams of experts with possibly
vested interests, by grasping the key science ourselves. Knowledge
is power. sceptics' issues have been rebutted by New
Scientist... But... Climate
Skeptic appears to have rebutted all of New Scientist's
rebuttals... Which is right? We need to be willing to examine
the evidence in many different disciplines that contribute
to Climate Science, and see where they fit together. Thankfully,
the start is very easy. Many "experts" seem to have
not noticed, or have ignored, the fundamental anomalies in
the temperature records we suspected above, evidence that
is right under our noses. Let's look further...
|
Let's go back
to the beginning, with evidence of temperature
and carbon dioxide levels from our fossil records...
...<<<<< here is a comparison
of CO2 and temperature throughout Earth history.
The present CO2 level (black) is a tiny fraction
of what it has been in the past, even after life
had blossomed. See how high CO2 has been. It didn't
kill life then, and some of the animals alive
then are still with us. See how temperature fluctuates
(white) between clear upper and lower limits -
thank goodness. See how ancient CO2 doesn't
correlate with temperature at all. So suddenly
it does, now?
H'mm... |
|
Central England Temperature (CET)
is the world's longest continuous temperature record. Now
although recent temperatures there look quite high, past temperatures
have at times been almost as high... and have increased faster
and more dramatically than in the last century... and now
we might well suspect there may be a problem with uncorrected
urban heat, since the US Military Academy record above shows
no overall temperature rise - whereas nearby New York does.
De Bilt is another long record
from the Netherlands. Difference of fluctuation patterns between
winter and summer is marked. Remarkably, recent mean annual
temperatures seem no different from those between 1850 and
1950.
Eight long European records: there
is a remarkable consistency with which they bear each other
out, thus confirming the trustworthiness of each individual
record. Again, current temperatures are no higher than temperatures
seen before on several occasions between 1780 and the present
time.
Difference between raw and final- what?
Are these records not what they seem? Why are recent temperatures
raised? Why so much? John Daly picked out interesting and
trustworthy records from all corners of the globe, especially
rural records, and made
them available. He did sterling work before he died, rescuing
the real Climate Science - a real gift to the next generation.
He uses the GISS dataset. Both "raw" and "adjusted"
sets are accessible at GISS - but not the adjustments code.
H'mmm...
Armagh vs CET: Armagh is rural
and close enough to CET to be comparable over this long time
span. Aha, there appears to be a slight unquantified urban
heat rise exaggerating CET.
...and let's
cast the net wide enough to get the whole picture...
Global averate temperatures: 1850
is as far back as we can go to reasonably estimate a "global
average" from thermometers direct. It looks as if there
is clear evidence of a 60-year cycle, with 30 years warming
followed by 30 years cooling. Is it possible that the overall
warming would disappear if urban warming was properly subtracted?
1998 temperature anomalies for the troposphere
(region of clouds) and lower stratosphere
(above the clouds). Anomaly signifies a temperature different
from a chosen "normal"; thus the red areas in the
Arctic only indicate some lessening of the normal cold; they
do not indicate warmth; moreover, Antarctica has basically
cooled, not warmed. H'mmmm... the models said that warming
would be more extreme in polar regions... The troposphere
shows a balance between warming and cooling, while the lower
stratosphere has been cooling a lot, particularly over Antarctica.
Arctic temperature patterns amplify
global patterns, show the solar connection
strongly,
and do
not show the expected CO2 correlation (above right). Note
the huge annual fluctuations of sea ice (below left, and at
Cryosphere
Today). Here
is an excellent source of information; see also my Polar
information page.
The Arctic is quite different to Antarctica.
Its sea ice has always been subject to huge fluctuations,
and the claims of "unprecedented melt!" are untrue
if we look for evidence before 1979 when satellite records
started. US submarines visited the North Pole regularly. Amundsen
sailed the Northwest Passage in 1906, and Nordenskjiold sailed
the Northeast Passage in 1878. Anecdotes, history, archaeology,
pre-CAGW
and post-CAGW
science from Greenland,
Alaska, and northern Canada should not be dismissed. Evidence
shows a cultivated medieval Greenland still frozen in permafrost,
many early navigations of the North-West Passage, a warmer
Greenland in the 1930's, ice-free Arctic Ocean, etc.
Antarctica: overall, this huge continent has
cooled in recent years - claims
of warming overall are mistaken, and its icecap and sea
ice have grown. Those who suggest the growth of sea ice is
due to "ozone hole" issues are "robustly"
answered in the negative here.
I answer the
Steig 2009 nonsense about the continent "warming";
intrepid amateurs O'Donnell et al publish a peer-reviewed
paper.
The warming spots are volcanic areas and there are warm ocean
currents from further north, affecting the maritime Antarctic
Peninsula where the well-publicised slight warming actually
occurred. There may also be a very good reason why Antarctica
cooled as the planet warmed - see Svensmark.
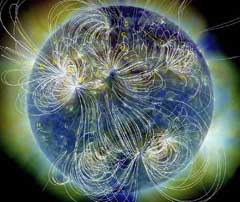
The global picture: the greatest
warming is in the vicinity of the North Magnetic Pole,
but there is also cooling: the greatest cooling is in
the vicinity of the South Magnetic Pole. All this seems very
unpredicted, and it has the feel of cosmic dynamics at work,
things we do not yet understand, that may involve the Sun's
sphere of influence as well as our own magnetosphere. It really
feels less and less like the work of humankind.
The record keepers: above right
are three different global records, MSU (satellite), GHCN
and HadCRUT3, with differences increasing up to an extraordinary
0.3 °C since 1979. When we consider that the total temperature
increase over a century is only 0.7 °C, this is a worrying
difference. Note that the satellite temperature is the lowest,
adding suspicion to the presence of undetected urban heat
effects in the other two records.
Psychology underpinning the keeping of records:
James Hansen keeps the NASA GISS global temperature records
(above left). Hansen came to this from astrophysics where
it was believed (almost
certainly mistakenly) that the hot little planet Venus
was suffering runaway warming from the greenhouse effect of
its thick CO2 mantle. Hansen's projected temperature rise
(green) reflects this; but in addition, the GISS records are
currently the highest of all four global records, and have
been adjusted several times in a way that increases the trend
to approach the green line. Chiefio
has documented all this.
Psychology underpinning the presentation
of evidence. Antarctica "Warming by Paintwork"
shows how quickly the mood shifted to alarmism. Yes, the colour
is meant to indicate temperature. Yet we are talking about
a continent whose temperature stays around -40°C and descends
to an unimaginable -70°C, where materials become brittle
and the stations get buried in snow after a few years, hence
the difficulty in keeping records; where, on the mainland
(not the tiny abnormal peninsula), temperatures always stay
well below freezing so no ice melt is even possible - which
explains why, every few years, great chunks of sea ice break
away and throw the media into a flurry of fainting fits. See
my Polar page for more
on this.
Now here is a killer piece: the
long temperature record of the ice itself:
IPCC dogma trumps
the evidence of Science...
President Eisenhower’s
famous 1961 farewell address to the nation included
two threat warnings. The well-known warning reminded
us to beware of the “Military Industrial
Complex.” The other, less-remembered
warning was “…that public policy could
itself become the captive of a scientific-technological
elite.”
Sir John Houghton, first head of IPCC, said “If
we want a good environmental policy in the future,
we’ll have to have a disaster” and
“The impacts of global warming are like
a weapon of mass destruction”. He did not,
however, advocate lying.
The current IPCC head Rajendra Pachauri, partner
in undeserved Nobel Prize with Al Gore, non-climatologist
(railway engineer turned businessman) with suspect
records and a private golf course, guilty of Glaciergate
and other IPCC lies and fudges, simply refuses
to resign. |
|
|
Now the role of the IPCC (Intergovernmental Panel for Climate
Change) was supposedly to “assess on a comprehensive,
objective, open and transparent basis the scientific, technical
and socio-economic information relevant to understanding the
scientific basis of risk of human-induced climate change,
its potential impacts and options for adaptation and mitigation.”
From its very mission statement we can see that
the IPCC was set up to find science that would back up a dogmatic
belief in CAGW, rather than consider openly
whether the warming could be natural, or even whether the
records of warming were of a sufficiently high standard. Indeed,
it appears that the reports have been edited to conform to
a desired message, see here
here and here.
IPCC made the Summary for Policymakers, published before
the science, the most important part of their reports, the
part people would actually read. Frederick Seitz (a past president
of the US National Academy of Sciences and American Physical
Society) blew
the whistle with an op-ed in the Wall Street Journal.
The doubts still reverberate
for many serious scientists. Unstoppable
Global Warming describes how principal conclusions
of the 1995 IPCC scientists ' key Chapter 8 were
rewritten - apparently to conform with a pre-arranged
Summary for Policymakers:-
- Where it had once said there was no discernible human
influence on climate, it was rewritten to say there was
now a discernible influence. This was done without reference
back to the scientists who had originally submitted their
final draft reaching the opposite conclusion.
IPCC
2007 says:-
- Warming of the climate
system is unequivocal, as is now evident from
observations of increases in global average
air and ocean temperatures, widespread melting
of snow and ice, and rising global average sea
level.
- ... Carbon dioxide
(CO2) is the most important anthropogenic GHG.
Its annual emissions grew by about 80% between
1970 and 2004.
- ... Most of the
observed increase in globally-averaged temperatures
since the mid-20th century is very likely due
to the observed increase in anthropogenic GHG
concentrations. It is likely there has been
significant anthropogenic warming over the past
50 years averaged over each continent (except
Antarctica).
...so
we hear everywhere the classic CAGW statement,
that
- "nearly
all climate scientists would
agree with three propositions":-
- First,
the climate is in a warming
trend.
- Second,
most of this warming trend
is down to human emissions of greenhouse gases.
- And third,
if emissions continue to rise then the result
will be continued warming which will become
damaging to us.
|
|
But "nearly
all climate scientists" is misleading -
Nearly all the above scientists
are in fact aware that:
- "First",
the warming trends were 1910-1940 and 1970-2000, not 1940-1970
or 2000-2010;
- we need to exclude urban heat island
effect and there is evidence
that UHI has doubled apparent warming;
- during this period, most
of Antarctica cooled - it did the opposite to the rest
of the planet;
- the sea is not getting hotter any longer - there
is no overall "storage of warmth" there;
- "Second",
temperature has levelled off after the latest 30-year rise
cycle, but CO2 has continued to rise steadily;
- CO2 rise fits sea surface temperature
rise far better than it fits the rising curve of our
emissions;
- we appear to have long ago reached the saturation
level of the CO2 greenhouse effect;
- The models say that the "fingerprint" of
a CO2 greenhouse gas effect will be excessive warming in
the tropical troposphere; but this has not occurred, see
here
and here;
- There is evidence that the Sun's recent output was
higher
than it has been for 8000 years. Total Solar Irradiance
is insufficient to explain the temperature rise, but the
correlation with the sun is undeniable (see below): all
we need is to find the drivers and amplifiers that could
cause the full temperature rise;
- There are serious concerns that some of the warming
may be due to undetected data issues like UHI;
- "Third"
- if CO2 is incapable of causing massive temperature rises,
or if the temperature rise is incapable of doing the damage
predicted, this fear is meaningless, and "actions"
will be useless..
- Monckton
and Spencer
and others show there is no evidence for "runaway tipping
points"
Let's get the
basic CO2 figures:
First, let's get a sense of proportion. Our CO2
emissions, compared with the natural planetary CO2 turnover,
are absolutely tiny. Seas store 50 times as much CO2 as is
in the air: a fact town-dwellers forget. Natural annual turnover
is 30-40 times our contribution. Thus it is quite plausible
that ultra-slowly-warming seas could be the cause of the continuing
CO2 rise. We can unpack the details later (under
CO2 follows temp and Lynching
of innocent CO2):
All the President's
Men
| I was now thoroughly
disconcerted. I'd found evidence that upset everything
- apparently. All the evidence I'd found had supposedly
been "dealt with" by New Scientist,
Gristmill, Royal Society etc in their "answers
to sceptics" - but it had not,
in spades. Still, with so much insistence that
"our CO2 emissions are responsible for global
warming", I could not be sure that I had
found enough evidence until I'd doubly checked
both sides of each issue - prosecution
AND defence, plus prosecution's answers to defence
AND defence's answers to prosecution.
This fourfold level of investigation was the real
eye-opener. |
|
|
| I
found I was keeping company with the very sceptics
I had been told I should ignore. "Monckton?
he's long been discredited by real climate scientists,
he's not even a scientist himself, but his scientific
language fools Telegraph readers. Get real".
Al Gore, Gavin Schmidt, Prof Abrahams and others
have "discredited" Monckton - but Monckton
has replied to all these in considerable detail,
eg when I
read this, the evidence obliged me to credit
Monckton highly, and to discredit Al Gore. And
despite lacking a science degree, his scientific
paper was published by a top American science
magazine. Again, warmists complained - without
due cause, since Monckton's paper was perfectly
sound - and his paper was ring-fenced.
The diagram here suggests how a
cycle of anxiety and propaganda could yield inordinate
power to a few scientists, politicians, media
and businesses. This comes from Courtney's very
telling history
of CAGW in the UK. It doesn't say that most
scientists are corrupt - it is simply a suggestion
of how corruption could have appeared and grown.
Positive feedbacks promoting imagined
risk of global warming -----> |

|
|
While
all major scientific bodies support CAGW, scientists
cannot get funding,
peer reviews, promotion, publication, or even
fair
mention in Wikipedia if they do not toe the
"consensus" line. Here's a real-life
example, where the conclusion contradicts its
own evidence - but supports CAGW (click to enlarge)
---->
Climate "sceptics" tell "horror
stories" of suppression. This situation
was already pretty well in place when Naomi Oreskes
claimed a "consensus" among scientists.
To check the invalidity of Oreskes' census, read
Benny Peiser's challenge AND his response to his
detractors who rubbished his challenge (URL's:
scroll down from Summaries) |

|
|
What doubled my sense of horror was to realize the extent
to which many scientists (not those above) were following
bad science, forgetting basics of science and scientific method,
and ignoring or even trashing good science, without the apparent
ability, or apparent realization of the need, to check the
basics for themselves; many seemed to think that no sceptic
has written peer-reviewed papers; and that only peer-reviewed
papers and IPCC are to be trusted. Horrors: the official scientific
bodies all have science-lookalike pieces that seem to explain
away all the sceptics' issues.
The worst find was "brownshirt" activists who had
insinuated themselves into positions of power and were trying
to suppress all dissenting views, vilifying the high-profile
sceptic scientists who speak up, using lies, half-truths,
coercion, and suppression, often claiming falsely that sceptics
must simply be in denial or in Exxon's pay pocket. Sadly the
BBC, once a paragon of virtue and an example to the world,
has
fallen very low. I never thought I would be thankful for
the
Great Global Warming Swindle. It's not my cup of
tea as a film. But its director has my admiration for how
he stood up to Bob Ward, ex-manager in "policy communication"
for the Royal Society, who
fought fanatically to try to suppress the Swindle
DVD. Dr Vincent Gray's insider's descriptions
of the IPCC gave me much-needed evidence of an IPCC serially
intent on devaluing natural causes of climate change. But
his strong language make him an easy target for CAGW
repudiation that ignores his vital valid points.
Then came Climategate!
It's important to try and understand how a false "science-lookalike"
could have built up. It seems so improbable. But we do not
need conspiracy theories. "Noble
cause corruption" ("the ends justify the means")
is a good start (see also here).
Willis
Eschenbach gives a classical statement of pretty well
every scientific principle that is being abused in Climate
Science. Funny thing is, the 70's cooling scare was
reported with exactly the same ill-informed hysterical
language. Koutsoyannis
and others
have studied serious problems with peer review in science
today. Peer-review becomes harder to maintain, the smaller
the specialist group becomes, and the more its findings become
(or are portrayed as being) incomprehensible to lesser outsiders.
Read Prof Segalstad's
story. The concern with our effects on the climate generally
started innocently. See Spencer
Weart. Then a "sorcerer's apprentice" situation
developed: in the '70's Thatcher cut research funding except
for pro-CAGW research, in what was, then, a reasonable concern.
Alas, there was no thought for how the money teat would drive
the formation of conclusions, and set up a vicious circle
of alarmism-for-funding and persecution of a dwindling number
of outspoken scientists. See Richard
Courtney. In the eighties / early nineties, some Big Businesses
stepped in to fund research to deny CAGW. But with growing
levels of apocalyptic fears, and with awareness that such
fears can be manipulated for political gain, the scales tipped
again, and now big business funds CAGW (eg Al Gore's own oil
company) - there are claims
that CAGW science gets effectively 2000 times the amount of
funding that sceptics get, despite continuing CAGW
cries that sceptics get "oil funding!" But scientists
are speaking
up, and Inhofe's
list of 700 scientists including Nobel prizewinners, is
increasing at about 4 a week.
| It
is the most basic principles of Scientific Method
that have been badly and serially transgressed,
that Climategate proved. This is why climate sceptics
are so upset. Claims that "the debate is
over" are a classic refuge of crooks. I
have written this Primer to help people reclaim
a basic understanding of Science and Scientific
Method, and how it plays out in "the real
world". Listen well to Willis. |

|
|
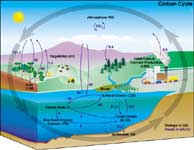
If we clear the tsunami of bad science, we can find a core
of good science that has been growing under wraps.
Trenberth's diagram (above) of heat transfer in our atmosphere
is used by the IPCC. The absorption characteristics of different
"greenhouse" gases (right) are measured and beyond
dispute. The
Air Vent explains. But the key issue here is, does
the temperature actually go up seriously with increasing CO2
(and other greenhouse gases)? Hansen says YES!!!! RUNAWAY
WARMING COMING SOON!!!! Many factors suggest otherwise. But
this is an area where people get dogmatic with many different
apparently physics-based and mathematically-justified points
of view, and it is quite difficult to be sure what really
happens. Monckton (below) sidesteps all that by turning the
IPCC maths on itself.
The heart of
the science controversy - IPCC and greenhouse gas effects
Sceptics say that the CO2 greenhouse effect is grossly overestimated,
has already reached its maximum level in being already effectively
opaque, and does not have any serious "amplifying"
effects threatening to tip the planet into runaway heating.
The true main greenhouse gas is water vapour, but this is
much harder to quantify or predict as it is so changeable.
Monckton wrote a very readable
article "Climate
Chaos? Don't believe it" for the UK Daily
Telegraph. Key extracts:
I'll show how
the UN
• undervalued the sun's effects on historical
and contemporary climate,
• slashed the natural greenhouse effect,
• overstated the past century's temperature
increase,
• repealed a fundamental law of physics
• and tripled the man-made greenhouse effect...
The UN adjusted the maths and all
but extinguished the sun's role in today's warming.
Here's how:
• The UN dated its list of "forcings"
from 1750, when the sun, and consequently air
temperature, was almost as warm as now. But its
start-date for the increase in world temperature
was 1900, when the sun, and temperature, were
much cooler... [It] estimated that the sun caused
just 0.3 watts/m2/sec of forcing since 1750. Begin
in 1900 to match the temperature start-date, and
the base solar forcing more than doubles to 0.7
watts. Multiply by 2.7, which the Royal Society
suggests is the UN's current factor for climate
feedbacks, and you get 1.9 watts – more
than six times the UN's figure.
• Next, the UN slashed the natural greenhouse
effect by 40 per cent from 33C in the climate-physics
textbooks to 20C, making the man-made additions
appear bigger.
• Then the UN chose the biggest 20th-century
temperature increase it could find. In the US,
20th-century temperature went up by only 0.3C.
AccuWeather, a worldwide meteorological service,
reckons world temperature rose by 0.45C. The US
National Climate Data Centre says 0.5C. Any advance
on 0.5? The UN went for 0.6C...
• Even a 0.6C temperature rise wasn't enough.
So the UN repealed a fundamental physical law.
Buried in a sub-chapter in its 2001 report is
a short but revealing section discussing "lambda":
the crucial factor converting forcings to temperature.
The UN said its climate models had found lambda
near-invariant at 0.5C per watt of forcing. You
don't need computer models to "find"
lambda. Its value is given by ...the Stefan-Boltzmann
law, not mentioned once in the UN's 2001 report,
[yet it is] central to the thermodynamics of climate...
The bigger the value of lambda, the bigger the
temperature increase the UN could predict. ...Lambda's
true value is just 0.22-0.3C per watt. In 2001,
the UN [doubled] lambda to 0.5C per watt. A recent
paper by James Hansen says lambda should be 0.67,
0.75 or 1C: take your pick. Sir John Houghton,
who chaired the UN's scientific assessment working
group until recently, tells me it now puts lambda
at 0.8C: that's 3C for a 3.7-watt doubling of
airborne CO2. Most of the UN's computer models
have used 1C. Stern implies 1.9C. On the UN's
figures, the entire greenhouse-gas forcing in
the 20th century was 2 watts. Multiplying by the
correct value of lambda gives a temperature increase
of 0.44 to 0.6C, in line with observation. But
using Stern's 1.9C per watt gives 3.8C.
|
|
• Finally, the UN's
predictions are founded... on an excessive rate
of increase in airborne carbon dioxide. The true
rate is 0.38 per cent year on year since records
began in 1958. The models assume 1 per cent per
annum... In 2001, the UN used these and other
adjustments to predict a 21st-century temperature
increase of 1.5 to 6C. Stern suggests up to 10C.
A simple global model shows that temperature will
rise by just 0.1 to 1.4C in the coming century,
with a best estimate of 0.6C, well within the
medieval temperature range and only a fifth of
the UN's new, central projection.
Schmidt, who runs
CAGW's flagship propaganda blog ** RealClimate,
rudely dismissed Monckton's "Cuckoo Science".
Monbiot
then claimed in The Guardian to have
"discredited" Monckton, quoting Schmidt.
Monbiot wrote "[Monckton's] claims about
the Stefan-Boltzmann equation have been addressed
by someone who does know what he's talking about,
Dr Gavin Schmidt of Nasa's Goddard Institute for
Space Studies..." But...
Monckton wrote
Chuck
it Schmidt which rebutted every detail of
Schmidt's "Cuckoo Science".
Monckton made the science clear, removing the
insulting language with which Schmidt's dismissal
is peppered; and showed, moreover, that Schmidt
himself had not grasped the matter properly.
“The Earth is not a black body!”
Schmidt wrote, implying that Monckton had failed
to grasp this elementary point.
Monckton wrote in reply:
My article and the supporting calculations
took full and explicit account of the fact that
Earth/troposphere emissivity is not 1 (for a blackbody)
but ~0.6 (the Earth being a badly-behaved greybody).
Schmidt had seen the supporting calculations,
because he later mentions the “M climate
model”, to which my article did not refer
by name. Schmidt ought to have known that the
Stefan-Boltzmann radiative-transfer equation,
often miscalled the “blackbody” equation,
is in fact capable of representing not only blackbodies
(emissivity 1) that absorb and, by Kirchhoff’s
law, emit all radiation, but also whitebodies
(emissivity 0) that reflect all radiation, and
all graybodies in between. Schmidt here erroneously
implies that this fundamental climate equation
applies to blackbodies only. A fourth-rate zoologist
in the UK lifted this unfortunate implication
from Schmidt’s blog without checking it,
and repeated it in a UK newspaper, which was obliged
to print an article correcting this and other
schoolboy errors arising from Schmidt’s
blog on the following day. |
|
** See below for more about RealClimate.
Schmidt still has no reply
to Monckton's rebuttal of his "Cuckoo Science".
This is of key importance. Had Schmidt been able to reply,
he would not have passed up this opportunity to prove a key
issue of the CAGW thesis, and to silence opposition. Schmidt,
in his July 2008 RealClimate "rebuttal"
of Monckton's July 2008 APS
paper, refers to Monckton's "previous attempt"
as if his "Cuckoo Science" rebuttal had disproved
and silenced Monckton, which we can see was not the case.
Monckton thus still stands vindicated. It's easy to
wave equations or computer models in someone's face to say
they prove something. But it's not so easy to fool someone
who is a scientist or statistician, or has an eye for fraud,
or has actually studied Climate Science.
Monckton has shown that the
greenhouse effects of CO2 have been calculated incorrectly
- much higher than the IPCC figures themselves dictate. Thus
the whole "greenhouse" basis of CAGW comes unstuck
- the credibility of the IPCC comes unstuck - and the expensive
"fixing" of nonexistent problems comes unstuck.
Fresh air
at last with Svensmark and Cloud Science
|
It was hard work
to extract myself from a mire of contradictory
"science" claims, from former friends
and scientists I now believed were seriously mistaken
if not knowingly fraudulent, and from a lot of
self-doubt. But the polar bears are fine after
all [9].
Eventually I was ready to investigate the work
of Svensmark et al. Reading "The
Chilling Stars" was like climbing a mountain
and suddenly finding oneself emerging from rain,
wind, and poor visibility, into clear, sunlit
pastures above. This new
science really fits the whole of earth history,
and can explain all the many twentieth-century
anomalies with a single factor. Simple and beautiful,
and like Cinderella's Shoe. Svensmark and others
are showing, inch by inch, an unremitting correlation
between the level of cosmic rays and the quantity
of low cloud. By increasing Earth’s albedo,
or whiteness, more solar energy lost by reflection.
Black warms; white cools. Now over the last 100
years, the Sun’s magnetic flux increased
by 230%, in addition to its sustaining a TSI “high”
longer than it has done for 8000 years. The high
TSI heated the huge ocean reservoir gradually,
and the high solar magnetic flux lowered the level
of cosmic rays. Less rays, less clouds, more warmth.
Data fits theory pretty well, and all this suggests
that after all, the Sun is a prime driver of temperature
changes. New experiments are starting to give
an idea of how the cloud-forming mechanism could
work. |
|
<<<Geologist
Jan Veizer and astrophysicist Nir Shaviv confirm
that there has been a strong correlation between
high cosmic ray levels and a cool Earth, throughout
Earth's geological history, as it has moved through
different sectors of the Galaxy.
Svensmark's material has been rubbished [15].
But in one instance that looks suspiciously typical,
he was simply not allowed the normal space to
defend his science when it was attacked by Laut
in 2003, and Damon and Laut in 2004 [16].
Actually he has written very fair rebuttals
of both Laut's papers. He pointed out mistakes
in Laut's science, fallacies in Laut's rebuttals
of Svensmark's science, and Laut's discourteous
language. |
 |
You have to read both
sides' answers to each other, to see that
Svensmark is both correct and courteous, unlike
the other side. Svensmark's website flushed out
a serious bias in Wikipedia I wouldn't have known
otherwise: mention of Laut, but none of Svensmark's
reply to Laut. Also, see [57]
re Lockwood & Frohlich's dissent.
Svensmark's studies also bear out the Antarctica
anomaly: with clear skies, brilliant-white Antarctica
cools while the rest of the Earth warms. See U-tube
of Svensmark's work here,
here,
here,
here
and here.
Recent
changes in albedo do correlate
well with recent temperatures.
The real science now starts to look a lot more
simple and beautiful. |
|
It is unfortunate that so
much has been taken over by strident activists
and bad scientists - and not just in Climate Science,
but also in other disciplines that have a bearing
on climate science. The result is that some of
the most important and beautiful developments
are sidelined, squashed, steamrollered by abuse.
Very interesting areas of exploration for understanding
the real drivers of climate lie in the atmosphere
and the cosmos: not just the sun but
the whole solar system and its "barycentre",
and the galaxy beyond. The biggest driving forces
of the cosmos appear to be electromagnetic
in nature. See here
and here.
The second link also has answers (here
here)
to those who may have written this off on the
strength of "debunks".
As with Svensmark, read the replies to the "debunks".
Many "climate sceptics" have an understanding
- or hunches - that this is how the science works.
But the basics are not yet accepted by mainstream
astrophysics - and enthusiasts are liable to make
claims they cannot substantiate - that may or
may not be true if explored more rigorously!
Perhaps this is why it has been possible for
dogmatic academics and "green" alarmists
to be accepted with their rogue certainties about
"disasters ahead!"
Easy answers for people who dislike uncertainty. |
|
Science
makes sense again! It is the Sun, here are the key
factors:

|
THE
SUN
warms the planet. Tiny variations
in its TSI (Total Solar Irradiance) correlate with
huge effects.
SOLAR POWER is around
24,000 times greater
than what we generate today. |

|
|
 |
- GLOBAL TEMPERATURES rise
overall in step with increased total solar irradiance
(TSI), and fall with increased "albedo"
- whiteness - from ice caps, from cloud cover
-and with occasional large volcanic eruptions.
- HUMAN EFFECTS
are from urban warmth, change of land use, surface
station locations and changes, and bad data
management.
- OCEAN CURRENTS
act like huge, slow messengers whose
complex cycles strongly affect land temperatures
(blue panel, below right, no.3).
- CLOUD COVER
varies significantly according to the
solar magnetic flux (blue panel, left). Clouds
reflect significant warmth into space.
|
- THE
SUN'S RECENT ACTIVITY
- solar magnetic flux between 1940
and 2000 was at a very high level(top left).
Scafetta quantifies solar effects here,
here
and here;
here
he replies to criticisms. TSI change is too
small to be the direct cause; but the correlation
is there. Scafetta also notes solar
correlation with planetary movements. This
is a contentious issue among non-Russian climate
sceptics but there is good evidence, backed
by good scientists like Landscheidt.
- THE SUN'S VERY RECENT ACTIVITY:
Solar output has fallen again (no sunspots
at present!), and the earth has now been cooling,
slowly and with variations, but unmistakeably,
for ten years.
- OCEANS ARE PLANETARY RESERVOIRS
- 1000 times the thermal capacity of
the atmosphere - that take a long time to heat
or cool. Geological records show CO2 lagging
temperature by around 800 years;
the slowest part of the thermohaline cycle is
also approximately 800
years.
- CO2 AND OCEANS:
Oceans, at 70% of the earth's surface
area, release huge quantities of CO2 in the
tropics, and absorb huge quantities of CO2 at
polar latitudes. Oceans hold 50 times as much
CO2 as is in the air.
- SEA
LEVELS have been steadily
rising since before fossil fuels though
this appears to be slowing or even stopping
now. The rise has nothing to do with melting
icecaps since Antarctica's increase easily balances
any Greenland melt.
- OUTGASSING
OCEANS: But the slow thermohaline
current still tells of the Little Ice Age (Akasofu)
- the tropics could well be still outgassing
from this - THIS alone can explain the
CO2 increase.
- ATMOSPHERIC CO2
increases greatly with only a tiny
overall increase in sea surface temperature.
CO2 stays in the atmosphere for only a few years
(Segalstad
+ 35 other studies), not the many years that
the CAGW thesis needs.
- OUR
CO2 EMISSIONS are
tiny (c.3%) in comparison with the huge CO2
flux out of, and back into, the oceans and the
terrestrial vegetation and "leaf water".
Carbon isotope levels have been shown by Segalstad
and Quirke
as verification that the increase of CO2 is
natural and not from fossil fuels.
- CO2 AND THE BIOSPHERE
(BIOSEQUESTRATION): If
the ocean temperature rose by only 1ºC,
atmospheric CO2 levels would rise another 150
ppm by Endersbee's
actual graph figures. However, by the "atmospheric
pipe effect" the 150 ppm MEASURED rise
of CO2 represents an increase in CO2 "PRESSURE",
and the extra CO2 is absorbed by vegetation
by photosynthesis and by coral etc by calcification.
Endersbee's statistics are a little questionable
but highly suggestive - this is one of many
areas of ongoing study. See our CO2
page.
- CLIMATE SCIENCE IS STILL IN ITS INFANCY,
and there are still many areas of mystery,
particularly in atmospheric science and astrophysics;
but unfortunately, major claims that are seriously
mistaken or unproven, have been repeated as
fact while the Sun has been neglected because
TSI is not the "obvious" cause.
|
|
Key Correlations: but how to prove
what drives what??
Cosmic Rays ~ Clouds |
Sunspot numbers ~ Sea Surface Temp |
Temp
~ Sun + Oceans but not CO2 |
|  Shaviv
and Svensmark: High correlation between cosmic
rays and cloud. See the varying correlations in
the other graphs. Shaviv
and Svensmark: High correlation between cosmic
rays and cloud. See the varying correlations in
the other graphs.
Cyclic solar activity
is significant, modulated by oceans & clouds. |

TallBloke's graph (see WUWT
03:08 on 1/1/09) shows an impressive correlation
between sea surface temp and sunspots over 5 cycles.
SST is averaged over 43 mths (1/3 solar cycle).
|
(4) Ocean, sun, CO2 all together for best fit
to temperature.
(3) Temp. correlates with ocean currents even
better.
(2)Temp. fits Total Solar Irradiance much better
- includes mid-century dip.
(1) Temperature fits 100 years of regularly
rising CO2 records very poorly. |
 |
|
Temperatures correlate to the sun and oceans
far better than to CO2 overall (Joe
D'Aleo, above right). Dr
Glassman shows the strong correlation between the solubility
of CO2 and the CO2/temperature link, as shown in the Vostok
ice core data - irrespective of time. Lance
Endersbee shows a very high correlation between CO2 and
sea surface temperature - but the time frame is a bit short...
Arctic regions show a particularly high correlation
with solar activity, see here
and here;
they do
not show CAGW's predicted polar amplification of warming;
Antarctica shows an inverse
correlation due to sunlit ice having higher albedo
than clouds.
CO2: the short-term fluctuations
in its increase rate fit temperature fluctuations
closely. This pattern fits outgassing from the oceans; but
it does not fit the steady rise of fossil fuel emissions:
only the crude overall trends are comparable (see
below). Segalstad & Jaworowski say in Atmospheric
CO2 and Global Warming (pdf):
"The equilibration between CO2 concentration in
the atmosphere and in the sea is very short (about 3/4 year
according to Bolin, 1982). Therefore one might expect that
most of the annual man-made perturbation in atmospheric
CO2 would be visible in the Mauna Loa data. But the dramatic
"Mauna Loa" CO2 changes are not reflected in the
more steady annual emissions of fossil fuel CO2".
Is the rising CO2 even due to our
CO2 emissions? ...
Al Gore informs us it is due to us, because... the relentless
CO2 rise has behaved... just like our relentless emissions
rise... so what else could have caused CO2 to rise? However,
Al fails to declare a splice to this graph, a splice between
proxy and direct measurements of CO2. This produces another
Hockey Stick, just like the temperature Hockey Stick. Dr
Bradley also fails to declare the splice. The suspicion
is that the (proxy) CO2 levels in the ice cores is NOT a reliable
indicator of past global CO2 levels. There is strong likelihood
that some CO2 escapes before measurement, and there are many
problems, detailed here.
Now there is evidence for an alternative hypothesis. Henry's
Law states the proportion of CO2 that must dissolve in water
at any given temperature, and there is enough water in the
slow deep thermohaline current to provide a huge steady supply
of CO2. Joe d'Aleo demonstrates a clear correlation between
sea surface temperature (warm El Ninos pink, cold La Ninas
blue), volcano eruptions, and rate of rise of CO2. The thermohaline
current takes an estimated 800 years although clearly the
reality is more complex, fractal, and approximate. Still,
there is ample reason for allowing hundreds of years' recovery
time from the Little Ice Age; the cold water that sank then
in Arctic regions will slowly surface at the tropics and outgas
what it dissolved hundreds of years ago. People
forget that two-thirds of our planet is water, and that is
just surface area. In reality, we need to remember its mass,
thousands of times that of the atmosphere, and its slowness
of circulation.
|
We
forget about the
huge power of warming oceans to outgas CO2
as solubility decreases (Henry's Law)--->
<--- and the likelihood
of slowly warming oceans - shown by the steady
rise of sea levels since before fossil fuel CO2
rise. |

|

|
Fluctuations
in total CO2 levels fit temperature fluctuation
details --->
<---
whereas they do NOT fit the details of
our steady fossil fuel CO2 emissions rise. |
|
|
...Anyway,
er, carbon dioxide follows temperature, now...
| Taken from Josh Hall's post here
(scroll down to 11.38am) [48],
these graphs show a high "fit" for temperature-leading-CO2
but only a very low "fit" for CO2-leading-temp.
These graphs are explained further here.
Click on pics to see originals. Macrae
describes the same proof.
Below, centre, we see the extremely high correlation
between sea surface temperature and CO2 level
- independent of time - strongly suggesting that
CO2 levels fluctuate globally with sea temperatures.
|
 |

|
|
...as always... here's the pattern
of the last four Ice Ages...
 |
Al Gore said "The
relationship is very complicated but there
is one relationship that is far more powerful
than all the others and it is this: When
there is more CO2 the temperature gets warmer,
because it traps more heat from the Sun".
He is misleading. <---In the
graph he used, it's impossible to see which leads.
The R.H.---> graph is the pink band widened.
When temperature is shifted to "best fit",
we see that temp. leads CO2 by
800 years - as if warmth causes
CO2 level to rise. |

|
|
See Caillon's 800-yr-shift graph
here.
Caillon shows no evidence that CO2 can drive temperatures.
But Lansner
and WUWT
show that, despite unsubstantiated claims
to the contrary (RealClimate
and here),
it appears that CO2 has never
amplified temperature.
<---This graph is a composite
of the last 4 Ice Ages. Very useful to see the
pattern. At any two points of equal CO2 concentration
there is a higher temp. when temp. is rising,
and a lower temp. when temp. is falling. This
is consistent with temp. leading CO2, but not
vice versa. Anyway, what causes the downturn if
CO2 has amplified the upturn? And parallel rising
lines prove CO2 has a linear fit to temp; if CO2
were leading, the CO2 rise would need to be plotted
logarithmically (each doubling of CO2
would have the same effect) to obtain parallel
lines. |
|
There's
good evidence that CO2 runaway warming is not even possible
In the Silurian Age, while the Earth emerged
from an ice age, CO2 levels dropped from 4000
ppm to 3000 ppm (0.4% to 0.3%). While CO2
levels have declined from 7000 ppm to the
current 350 +/- 50ppm, very ancient global
temperatures appear to have oscillated firmly between a lower
limit of 12ºC and an upper limit of
22ºC. The CO2 rise as ice ages end varies
between 200 ppm and 300
ppm. Today, with a temperature rise of less than 1ºC,
we appear to have seen a similar rise of CO2 levels (assuming
ice core levels are accurate proxies, which I dispute anyway).
There is no sign in any ancient records of runaway warming.
Revisit the video.
All the evidence says that CO2 does not affect
temperature, but temperature affects CO2.
IPCC's models predicted that as CO2 increased,
water vapour would also increase, giving a "feedback
loop" that would amplify temperature increase above that
expected from CO2 alone, to give 4-6ºC temperature
increase over this century - if CO2 levels increase
at the present rate. As temperature increased, IPCC reasoned,
relative humidity would stay constant, thereby causing absolute
humidity to rise. But relative humidity has not - in practice
- stayed constant.

|
<---- Real-life
observations show that as CO2 rose
in the last century, water vapour fell
Yet water vapour is a far more
powerful greenhouse gas. This change more than
balances any possible GHG effect due to CO2,
which is already at
near-maximum greenhouse effect ----> |
|
|
Miskolczi
says that we have a self-regulating atmosphere that causes
water vapour at a critical height above the Earth to fall
as the CO2 level rises, so that the fall in the GHG (greenhouse
gas) effect of water vapour balances the rising GHG effect
of CO2. Miskolczi is a brilliant scientist who worked with
NASA until his paper was refused publication, probably because
it gives evidence that a runaway GHG effect is categorically
impossible: a thoroughly non-alarmist stance that is not good
for attracting funds. There is also clear
evidence of NASA cooking the data for Venus, in favour
of Venus having a runaway GHG effect. I believe that Miskolczi's
science of greenhouse gases points the real way forward. It
fits real-life measurements beautifully, and provides a beautiful
and plausible theory. It is difficult to follow the maths
- but slowly Miscolczi is attracting a following, and Noor
van Andel explains a bit more clearly. The penny may drop
presently.
Erl
Happ demonstrates how the Earth Laboratory tests the greenhouse
theory once a year, every year, and finds it wanting every
time. I've also found
two excellent science papers showing the minuscule heating
effect of CO2 in atmospheric conditions, that should have
been published, one 1986, the other 1994 or so - but they
were suppressed. Who knows how many more have been suppressed.
The lynching of
innocent CO2
The scare science has been building up for quite a while.
Over a hundred years ago, Arrhenius suggested that if our
CO2 emissions built up, they could cause global warming. Interestingly,
his
grandson joined the same laboratory in the US as Roger
Revelle, who later became Al Gore's mentor. Revelle became
concerned that our emissions could become a problem - but
how to measure the CO2 levels well enough? So he set up a
station at Mauna Loa in the Pacific, far from any land-borne
influences, subject only to seasonal fluctuations, to measure
CO2, and appointed Charles Keeling as record keeper.

|
<---
Keeling produced this "stairway to heaven"
that converts people to CAGW.
But the rise is actually tiny if
we put it in perspective ---> |

|
|
Now the old, forgotten chemical CO2 records are being re-examined
by Beck,
Lansner
and others.
Keeling's son would like to see this evidence suppressed.
Yet Beck's records have a very high level of accuracy. They
are still effectively as accurate as Keeling's system (with
different issues) and were used, interestingly, for a short
overlap period in Scandinavia when Keeling started. Therein
lie some
important observations that cast doubt on the "infallibility"
of Mauna Loa. There is a problem of location, since winds
from forests and industries can create huge daily differences.
It is possible Beck's records indicate higher CO2 levels that
collapsed suddenly - this reflects the old Central England
temperature record (below left).
|

|

|
Old CO2 records fit old temperature
records |
Why was the ice core record
shifted to fit the new CO2 measurements? Is the
official reason acceptable? |
|
|
The ice core CO2 record (above centre) has been shifted forward,
to splice neatly onto the start of Keeling's record in 1955.
But this is a highly suspect splice, not checked over a proper
overlap period. Most suspiciously, it produces a "hockey
stick" with a sudden, recent, alarming rise, like the
temperature Hockey Stick. There are serious
questions about the reliability of ice core CO2 records regarding
past levels of greenhouse gases: the stomata proxy record
(above right) suggests far more variability, and a higher
level of CO2, than the ice core shows. Prof
Jaworowski, top expert in ice core studies, describes
all this and more. Jaworowski deserves proper study of his
Atmospheric CO2 and Global Warming (pdf)
that he co-authored with Prof Segalstad of Norsk Polarinstitutt.
He may not be 100% correct. But he was a far greater expert
on ice cores than myself, he followed scientific method, he
saw it being debased in his own professional lifetime, spoke
up, and was vilified. The pattern is distressingly familiar,
and makes me inclined to take him seriously and listen carefully.
The IPCC's alarm
picture, built on models, ignoring real factors & data
The greenhouse gas properties of carbon dioxide are well-known
to all sceptics. CO2 is opaque to some infra-red wavelengths.
The question is: do GHG effects actually increase
seriously, if present CO2 levels rise? The simple
answer is, no.

|
<<<< The models' rate
of predictive success is abysmal. Neither ground
temperatures (Hansen above) nor outgoing radiation
nor tropical troposhere temps (below) will play
ball.
IPCC sport several suspect gassy
ice hockey sticks >>>>
|

|
|
Here is the IPCC's chart of "forcings".
Many scientists have been worried about greenhouse
gases, from Arrhenius in 1896 on. Suggestive evidence was
noticed after temperatures started going up after 1970. Our
CO2 emissions seem a likely culprit - to a mediocre scientist
who ignores the mysterious sun; who forgets Henry's Law, the
size of the oceans, and the power of the biosphere; who ignores
all the studies showing the short lifespan of CO2 in the atmosphere;
and who fails to consider or measure the water vapour situation,
or the logarithmic GHG "saturation" effect, whereby
higher levels of CO2 make virtually no difference to its net
GHG effect. Here is the "elephant in the
sitting room", water.
IPCC has reinforced a dogma, extending the work of Callendar
(1949) Bolin & Eriksson (1959), Revelle, Keeling, and
Siegenthaler & Oeschger (1987) who were already building
up a thesis of global warming effects through our CO2 emissions,
while ignoring all the science that fundamentally challenges
this thesis. Monckton demonstrates IPCC's
serial fudging of GHG science, Segalstadt demonstrates
serial falsification of
CO2 science, Jo Nova explains how IPCC's
needed tropical tropospheric hotspot is missing,
and proved
missing.
IPCC 2007 is serially based on faulty methods and data and
non-peer-reviewed material. Donna Laframboise has investigated
IPCC thoroughly, see here
and here.
Glaciergate (here
and here)
tells how IPCC scientists used fake data to pressurize policy
makers. Amazongate
shows how WWF tried to rake in millions from fake scare figures
in the IPCC report.
IPCC leader Pachauri made misleading
claims at COP15. Glaciergate
involved financial advantage to him. Other conflicts
of interest and accounts
anomalies were reported. His company's golf course using
sprinklers in a parched Indian city was
reported - together with other luxuries totally at odds
with the message of IPCC. Weirdly in all this, he published
a soft
porn novel. As with Al Gore, another non-climate-scientist,
there is conflict of interests, a private fortune amassing
from "save the planet" work, and behaviour that
is massively at odds with a central message of AGW, leading
by example in lowering one's carbon footprint. We have rogues
in the driving seat, misrepresenting the science and making
money out of people's fears. And I believe that such rogues
will draw in more rogues, or naive scientists who are persuaded
to accept high-sounding alarms.
Milgram's
classic study shows how such "innocents"
can, under pressure, become ruthless torturers, deaf to pleas
from the "other side", in their desire to serve
what they have been told by "authority" is a "noble
cause". Climate sceptics thus become dehumanized and
lose the fundamental right even to be heard, in their eyes.
And to these "corrupted innocents" are added the
brownshirts (they exist to "support" both skeptics
and warmists) who project their personal violence by threatening
the life of the leaders of the perceived enemy.
Crucially, a paragraph of AR4 written by Trenberth/Jones
dismisses the
2004 paper of McKitrick and Michaels which demonstrates
UHI factors substantially greater than allowed-for in CRU
global temperature records. CRU still uses Jones & Wang's
1990 paper. But not only is the UHI here far too low, there
is also reasonable suspicion that this paper's claims are
fraudulent. Then to add insult to injury, Trenberth/Jones
tried to exclude all mention of MM2004. When that failed,
they claimed that it had been conclusively demonstrated as
unreliable. No such demonstration exists in fact.
My understanding
of the science of Carbon Dioxide, Staff of Life of all plants.
Enjoy Segalstad's friendly presentation
all about CO2. Watch (and do)
a kitchen experiment yourself! The following is my personal
gleanings and is open to improvements.
- We are emitting 3-4ppm (6-8Gt) carbon
dioxide each year, perhaps 2% of the total natural
annual CO2
flux.
- CO2 levels have been rising at around
1.5ppm, or 3Gt p.a. since Keeling's records
started in 1952, and are now around 380ppm (=750Gt).
- The total annual CO2 flux is huge
but just how big? - maybe 220 Gt p.a. (Holmen
2000), maybe 150 Gt p.a. (IPCC
SAR) (or more if one includes leaf water
and rain water?) - between 1/3 and 1/5 of the
total atmospheric CO2.
- Henry's Law says that CO2 is in
balance between the atmosphere and the oceans
in approx. ratio 1: 50... So only 1/50 of our
emissions should remain in the air, in theory...
BUT... (dividing 3.5 by 50)...
|
 |
- ...since the measured CO2 rise
of 1.5ppm p.a. is so much higher than the 0.07ppm
p.a. that should remain airborne from human
emissions, this alerts observant minds to look
for another cause of CO2 rise.
- Also, the CO2 level is rising
at about 46% of the rate of our emissions rise,
BUT it has a jagged profile of rise, which doesn't
fit the smooth rise of our emissions, but fits
temperature fluctuations.
- It seems
that to "prove" their bad science,
IPCC had to invent more bad science: they now
need CO2 to remain in the air for 50-200 years,
or more, which we can see, from the size of
the annual flux, is ridiculous.
|
|
- Segalstad
lists 35 studies based on 6 different factors,
which give lifetimes of between 2 and 12 years.
- IPCC stands out as the "odd one out"
in this, by an order of magnitude
- CAGW - and "townies" behind
computers - forget the massive area and volume
of the oceans that outgasses vast quantities
of CO2 with tiny temperature changes. The Greenpeace
CO2 cycle ignores the oceans!
- CO2
Science have been conducting experiments
with plant growth and maintain a formidable
collection
of information, backed by a strong ethical
committment
|
 |
- Dr
Floor Anthoni explains the "atmospheric
pipe effect" - the level of CO2 works
like pressure on vegetation to grow more.
- CAGW totally
underestimates biosequestration:
increased CO2 levels enable vegetation
to grow more, naturally sequestering CO2, as
the biosphere has done for millions of years
in response to erupting volcanoes and possibly
a steady trickle of CO2 from space.
- CAGW also
fails to consider the subtle oceanic balance
(see
here): more ocean CO2 enables more
plants AND enables CaCO3 to be precipitated
into corals and mollusc shells, by drawing on
ever-present Ca ions.
- Schoolchildren
are being taught lies! CO2 is Not Pollution!
|
 |
The capacity of plants
to take up CO2: This animation
of satellite data suggests the huge Eurasian
biosphere soaks up CO2 each summer. Since plants
depend on CO2 to live, and thrive on raised levels
of CO2 in greenhouses, the benefit of slightly
raised CO2 seems plain common sense. NASA
admit the effect and even have this
graph ---> documenting it. And this
graph shows how wrong Al Gore is to call CO2
a pollutant. Any studies seriously suggesting
otherwise are clearly in CAGW's pay pocket. |
 |
The
idea of carbon sequestration arises from an inversion
of Science.
* It would be robbery from the biosphere
* It would be very costly yet have zero effect |
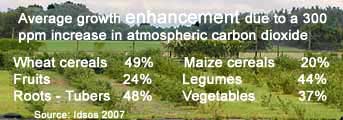 |
|
The strange
story of the missing Medieval Warm Period
IPCC 1990 and 1995 had this picture
[below, upper left] showing the Medieval Warm Period (MWP)
as portrayed by Hubert Lamb, first head of the East Anglia
Climatic Research Unit and author of competent climate studies
that give evidence of the MWP which was well-known to historians
as well as scientists.
 |
Anthropologists
and archaeologists are aware of the MWP from Viking
settlements in Greenland. They know from things
like places inhabited, plants cultivated. The
Schnidejoch pass in Switzerland [Svensmark &
Calder, The Chilling Stars] was used
regularly in Roman and in Medieval times; the
pass has only just reopened. But CAGW devalues
"anecdotal" and historical evidence
in favour of "proxy" temp. measurements.
In 1998 a study by Huang et al was published
of over 6,000 borehole records of the last 20,000
years, from which temperature proxies were read.
Here is the last millennium [lower left], strikingly
similar to the IPCC 1995 graph. The world experienced
a medieval warm period that appears to dwarf recent
changes. |

|
|
IPCC 2001: Someone
at IPCC wanted to erase the Medieval Warm Period from visibility...
Hubert Lamb was gone from CRU. The psychological climate had
changed, and CRU now believed in CAGW. Dr.
David Deming was welcomed into the close-knit group of
global warming believers after he published a paper in 1995
that noted some warming in the 20th century. Deming says he
was then contacted by a significant global warming scientist
who told him "we have to get rid of the Medieval Warm
Period." IPCC 2001 (Third Assessment Report) did exactly
this: it replaced Lamb's 1995 graph with Michael Mann's infamous
"hockey stick" prominently displayed six times,
to show "unprecedented" recent global warming.
Monckton
wrote "The UN says [the Hockey Stick] is not important.
It is. Scores of scientific papers show that the mediaeval
warm period was real, global and up to 3ºC warmer than
now." The Hockey Stick, amplified by Al Gore’s
visually hypnotic film, was used to shout down traditional
well-evidenced knowledge with propaganda
claiming that there never was a significant MWP.

|
<<<< Rudolf Kipp wrote
an article about all these studies of the MWP
- instant proof that it was global. Click the
picture to go straight to his interactive page
to view each study. Skeptical
Science's world map says the MWP was local.
But Jo
Nova also shows it was global - she's backed
up by...
686 scientists from 401 institutions
in 40 countries on the co2science.org
MWP database say the Middle Ages were warmer than
today. They now reference over 900 studies of
the MWP.
Monckton
lists 19 recent studies that clearly show the
MWP. Craig Loehle, the author of 200+ peer-reviewed
papers, wrote a paper
about 18 MWP studies. |
|
"Rewriting [countless textbooks] would take decades,
time that the band members didn't have if they were to save
the globe from warming" said Solomon in The Deniers.
Instead, "the Team" created a website called RealClimate.org.
"The idea is that we working climate scientists should
have a place where we can mount a rapid response to supposedly
'bombshell' papers that are doing the rounds" in aid
of "combating dis-information," Gavin Schmidt emailed
the Climatic Research Unit on 10/12/2004. Almost certainly,
RealClimate was targeted to oppose Steve McIntyre, who had
recently seriously challenged
McIntyre
and McKitrick broke the "hockey stick" -
false temperature graph
McKitrick
has an excellent account of the story. Canadian statistician
Steve McIntyre became suspicious of Michael Mann's IPCC 2001
"hockey stick" graph where the Medieval Warm Period
had disappeared. He had been an IPCC assessor, and his background
in auditing told him to beware any graph showing a sudden
recent rise. McIntyre requested the data from Mann so that
he could check the results for himself. Mann refused and obstructed.
In the end, Mc Intyre used the Freedom Of Information Act
to obtain material. He found that one proxy record, bristlecone
pine, had been given prominence 390 times the weighting
of the rest - because it had properties [see how its
rings distort] that could be made use of to compile a hockey-stick-shaped
record supposedly attributable to warming. Some of the other
data had simply been buried in a file marked "censored".
Ross
McKitrick tells the story. Longer histories of the malfeasance
are told by Bishop
Hill and Monckton
of Brenchley.
Al Gore's film 2006 Before Al
Gore's film, McIntyre & McKitrick had published refutations
of the statistics of the hockey stick, in 2003 and 2005. Their
work was subsequently supported by the Wegman report (2006)
for the US House of Representatives, and (re. the statistics)
by the North report of the National Academy of Sciences in
the US. Dr. Wegman is one of the world's most eminent statisticians;
his report found that the graph had “a validation skill
not significantly different from zero”. Unfortunately,
the media reported North's support for Mann's conclusions
of warming, but failed to say that North did not support Mann's
statistics, and thus gave the impression that NAS
approved the hockey stick. This belief still persists and
has been used to bolster support for the similarly worthless
2007 and 2008 hockey sticks.
Jeff
Id [above right] demolishes the validity of
Mann's statistical process... the past, particularly
the recent past, is automatically diminished in comparison
with the present... to always make a hockey stick... Notice
the family resemblance to both the original Hockey Stick and
the Luminous Spaghetti graph - subdued MWP, slowly dipping,
then kick up to a current high - a resemblance not shared
with a single one of Monckton's
19 studies and clearly not with Loehle's
18 studies. Loehle wrote another paper that summarizes
over 20 papers that challenge the use of tree-ring measurements
for proxy temperature measurement. Tree-ring proxies were
used to produce the original hockey stick - but these tend
not to show the MWP - perhaps because they measure
moisture not temperature. All other proxies tend to show
the MWP
Steve McIntyre runs Climate
Audit which deservedly won the 2007 award for Best Science
Blog. It provides crucial audits of bad IPCC statistics and
associated bad practice, and shows real science at work (the
proper use of statistics is science in its own right, and
is an essential part of almost all other sciences). But Steve
cannot get stuff peer-reviewed or published in the old, formal
sense; he has become an embarrassment to the establishment.
And the saga of obstruction continues.
The Team carries
on promoting bad science
RealClimate
is a blog run by members of the same clique as the original
Hockey Stick authors and GISS/CRU temperature record-keepers.
They actually chose to call themselves "the Team"
in a rare moment of self-recognition, and Steve McIntyre happily
adopted the name. Though few of them are fully-qualified climatologists,
they will readily insult sceptics who are not fully-qualified.
RealClimate was set up to belittle the work of Steve McIntyre;
Steve set up Climate
Audit in response. RC consistently refused to name him,
so Steve called himself "he who must not be named".
The Climategate emails showed clearly that Steve was in fact
watched closely, and abusively, as suspected. RealClimate
is a totalitarian non-debate made to look like a debate. They
have perfected the art. See here
and here.
But their readership is falling, whereas the support for sceptical
blogs has increased hugely. Eventually, Truth Will Out. But
BBC and the top science institutions are
still entrenched and refuse
to consider challenges to their science as anything but scumbag
"denialists" "in denial". Who are the
real deniers, we ask?
This well-known hockey stick, the "spaghetti graph"
appears to be formed by several independent studies. But analysis
of data below reveals "the Team" - they are anything
but independent of each other.
IPCC 2007 abandoned the original hockey
stick in favour of - another hockey stick [above left]. The
"spaghetti" graph looks different - but it's virtually
the same hockey-stick, disguised with minor concessions...
Look: (a) the data is from a limited set, bristlecone pines
and Polar Urals data sets are both highly suspect - see Steve's
2009 ICCC presentation [above right] (b) it's mostly procured
by "The Team" [both diagrams above]; (c) the MWP
is still devalued way below what the real evidence suggests,
(d) the graph still uses the same unholy splice of data –
thermometer for the twentieth century and questionable proxies
for earlier - despite existing temperature records.
Hockey Stick 2008 The Team constructed
yet another Hockey Stick. Despite no tree-ring temp. proxies,
the latest model bears every sign of the original flaws: cherrypicking
proxies that are already suspect (contaminated Finnish lake
sediment)... the unholy maths that automatically produces
a hockey stick... To add insult to injury, BBC has been parading
the original hockey stick (Iain Stewart, Climate Wars)
as if it had never been discredited by top statistician Wegman.
Yamal Sept-Oct
2009 Steve
McIntyre finally got data after years of asking
- data that should have been released with the
original publication. One of the three rogue records
used to maintain the IPCC Hockey Stick depended
on just 12 trees, with 1 rogue outlier YAD 061.
Bishop
Hill tells the story, and I did three pages
with pictures. See here
here
and especially here,
where you can see the "treemometer"
records direct and compare with all the local
Siberian thermometer records (GISS). |
|
|
Climategate
17 Nov 2009 This followed close on the heels of Yamal,
thoroughly eclipsed it, and proved everything Steve Mc Intyre
and co-researchers had suspected, especially insiders' corruption
of the peer-review process - even while believing they were
"saving the planet".
Antarctica Dec 2009 The Team's next
iniquity was Steig's paper that purportedly showed Antarctica
warming. Nature magazine proudly showed Antarctica
coloured yellow and red - despite a continental average of
around minus 40ºC, and a measly warming of a fraction
of a degree. Even that "warming" depended on (1)
choice of start and end dates (2) including minor and unrepresentative
areas that are warming slightly and (3) highly suspicious
statistics. Yet the warmist models "predict" that
polar regions should show the greatest warming. See my paragraph,
Warming Antarctica
by Paintwork.
O'Donnell Dec 2010 After a year, sceptic
amateurs Ryan O'Donnell, Jeff Condon (Jeff Id), Nick Lewis,
and Steven McIntyre managed to publish a rebuttal to Steig
(see here,
here
and here),
but not before running the gauntlet of a ridiculous number
of silly objections that still continue (see here
er seaa for detail, here
for the nub of the matter, here
for story). Still the blocking, refusal to release data, name-calling,
misleading quotes, and failure to mention criticism, continues.
Alarmist diehards are continuing
to fight for an indefensible
science.
Urban Heat Island
effect and other issues of data corruption

|
The UHI effect probably
wipes out all of the recent global temperature
rise in excess of solar-linked rises
and ongoing recovery from the Little Ice Age.
Warwick
Hughes' two graphs [left] show a huge discrepancy
between urban and rural weather station records
in Australia, and suggests there has been
no temperature increase at all, unlike what
the CRU record appears to show. I have done a
whole article
on studies comparing urban and rural records:
the same discrepancy is borne out over and over
again.
GISS made adjustments
of temperature data in the wrong direction,
Steve McIntyre showed. See
Ken Gregory June 2008. CRU make adjustments
which are still very unclear and un-repeatable,
and which still lean on Jones & Wang's 1990
paper showing minimal UHI effects to correct for.
|
|
Here
and here
are examples of increasingly big and unjustifiable
alterations to the raw global surface temperature
records. Chiefio
has blogged at length about all this.
A 14-year-old
boy could conduct a perfectly adequate survey
of the UHI effect, to reveal a difference of about
5 degrees C between city centre and countryside.
The number of weather stations worldwide
was drastically cut around 1990.
This happened mainly in rural locations, and ,
surprise surprise, the "average temp"
suddenly rose at the same time [lower left picture].
|
|
Three out of four global temperature records
are managed by the US; they have a record number
of weather stations and should be world leaders,
yet... The majority of US weather
stations are sited very badly, near
tarmac, heat exchangers, airplane exhausts, barbecues,
warm buildings, sewage plants, etc, falling far
short of AMS' own standards, with the majority
likely to record positive errors of 2-5ºC.
Such stations amplify the UHI effect still further.
Anthony Watts used material from his surface
stations project, run by volunteers, in a
paper
which show that 90% of all US station records
are untrustworthy, with rises in urban areas that
are unmatched by reliable rural records. |

|
There are so many
data problems it looks like a policy-driven deception,
to allow more and more warming in the surface
temperature records.
<<<< See the paper
by Watts and d'Aleo. The increasingly over-warm
records do two things: they hide the solar link
so people can continue to blame CO2; and they
make the warming look really bad.
See here:
Jones and Trenberth in IPCC AR4 changed the wording,
without proper agreement, so that the 2004
paper on UHI by McKitrick and Michaels appears
to have been rejected due to faulty statistics,
whereas it never was: it is perfectly valid. This
"rejection" enables the (misleading,
possibly fraudulent) Jones & Wang 1990 paper,
or its 2008
"update", to continue in use. |
|
Alarmism and
irresponsible reporting
Here you can see the true pictures and graphs. However, they
are not what the mainstream media like to announce; they are
not alarming. Unfortunately too, the number of scientifically-trained
reporters (and politicians) appears to have decreased in proportion
to Science having grown more complex and therefore needing
better informed science reporting.
Just think what the BBC could do, to sponsor truly independent
reporting - since its revenue is NOT dependent on advertisers
or purchasers whose prejudices have the power to skew all
other mainstream media. What a golden opportunity for integrity
the BBC is losing, trading on past glories that were honestly
earned. This corruption has happened in the last ten years:
before that time it was actually possible to get a fair and
scientific appraisal in BBC programmes. Now we have despicable
propaganda. But I live in hope that the BBC will be called
to account. The public are slowly but surely waking up, and
seem to understand the science a great deal better than those
who think to broadcast to us what to believe.
- Dangerous sea
level rise is a scare story. Sea levels
have been rising, but on average only by the tiny 1.6mm
p.a. that corresponds to thermal expansion, and even this
has recently slowed.
- Dangerous ocean acidification is a scare story.
Marine fauna use the plentiful Ca++ ions with dissolved
CO2 to build shells. See here
and here.
Overall acidification is a scientific impossibility the
alarmists overlook: firstly because 50 times as much CO2
is in the oceans than is in the air anyway, secondly because
the worldwide Ca++ stocks get replenished to soak up any
spare CO2. There is plenty of spare calcium. The actual
problems here are mostly local pollution issues.
- Greenland was warmer in the past, both
in
the 1930's and in the Middle Ages.There are medieval
settlements in Greenland still buried under modern permafrost.
People have short memories.
- The big global ice sheets are growing if anything.
Local effects in Greenland
and the Antarctic peninsula are NOT global patterns; effects
of ocean currents and volcanic activity in these areas get
ignored or forgotten.
- Aerosols
cause local effects eg smog; the true global effects are
far less certain; volcanic aerosols cool.
- Other greenhouse gases: Methane is doing
its own thing; there is serious evidence casting doubt on
the CFC link to the ozone hole which fluctuates naturally
and regularly.
- Hurricanes: there is no overall trend.
However, escalation of insurance claims can give a misleading
impression of rising storm power, which disappears when
we use GDP as index of costs.
- Tornadoes? With modern means, more are
reported; but there are less of the severe tornadoes.
- Volcanic activity warms some
polar areas.
- Glaciers have been melting for 200 years
- and most of the world's glaciers, which are on Antarctica,
have been growing.
- Polar
bears? Mitch Taylor worked with them for thirty
years, and knows that their numbers have greatly increased
– due to limits on hunting - but they’ve survived
warmer times in the past are not under any threat now.
Facing the
Truth: does Science face a new Dark Ages?
For at least the last decade, CAGW activists have trumped
sound previous science with bad science, or have ignored or
vilified new evidence challenging them; as the dates on "Warming
by Paintwork" suggests, the corruption has been rapid.
All the chief science organizations (outside China, Russia
and India, perhaps) claim that manmade global warming has
been proved; they have refuted serious sceptics' arguments
with what they claim is fair science, but is nothing of the
sort. Debates have been consistently shunned, while the claim
is made that "the debate is over, there is consensus
among all responsible scientists". Some who see such
lies being shamelessly pushed, fear a previously unthinkable
return into a new Dark Ages. At no point have IPCC's
two fundamental theses been confirmed by evidence.
Many experts, seeing only their
area of expertise, have said, "I believe in CAGW... except
for what my area of expertise shows". This is corruption
in the very heart of the scientific process. Here I've
tried to join up the dots...

|
...for instance, all of this displays
the same tricks that were used to publish the
notorious Malleus Maleficarum. Kramer and Sprenger
printed a fake approval for all copies sold outside
Cologne, the town of the censors, but in Cologne
itself they omitted the fake approval. This convinced
everyone outside Cologne that the book had the
approval of both the Pope and the censors, when,
in reality, it had no Papal approval and it had
downright condemnation from the censors. By the
time the discrepancy was noticed, it was too late,
the masses were rarin' to go beat the hell out
of the witches, and the Pope was cornered into
conceding support. |
 |
|
"It is unfortunate that the integrity of science
will be badly damaged by alarming the public without solid
scientific foundation" says Prof.
Akasofu. "Although it is often reported that
there is “consensus” among scientists... this
situation has no comparison to the consensus among many scientists
at the time of the nuclear crisis in the 1970s and the 1980s,
when scientists alarmed the world. The difference between
them could be compared to a dinosaur (which was proven to
exist) and a dragon (which is an imaginary creature)... Scientists
are responsible for clarifying and rectifying the confusion."
How could this have happened? How could so many scientists
have been mistaken or silent or disempowered for so long?
How could apocalyptic anxieties and politics have undermined
the heart of Scientific Method so completely in Climate Science?
How can we be sure now that Science is trustworthy anywhere?
How can we be sure what our real global problems
are, if the science foundations we need are so thoroughly
corrupt? Truth matters.
Speaking Up,
What is the solution?
Many prominent sceptics including Lawrence
Solomon, Anthony Watts and Senator Inhofe used to
believe in CAGW but became disenchanted. Many have
been punished for their views by being denied legitimate recognition
or employment, and most have seen some form of personal attack.
The Oregon
Petition Project is signed by 31,000 scientists who don't
accept CAGW. What, 31,000 scientists don't know what they're
talking about? It has been attacked unpleasantly; to
answer such attacks, visit its FAQ
page and meet Art
Robinson - an inspiring fighter, even though one may disagree
sometimes... Readership of Watts
Up With That and development of similar blogs have increased
a thousandfold. Books are appearing more and more.
Inhofe's list is growing daily and now holds over 13 times
as many scientists as were ever involved in IPCC; some are
defectors from the IPCC. James Hansen's former boss Dr John
Theon said at
the 2008 ICCC conference:
"I worked as the head of the NASA Weather and Climate
Program which included up to 300 scientists in NASA, in
academia, and in the private sector... Jim Hansen had...
some very powerful political friends. Al Gore was a Senator...
and subsequently became Vice President of the US. Now there
isn't too much a NASA person can do when he's up against
that kind of a challenge... In the early '90's I realized
the whole thing was a great big fraud... Recent developments
have convinced me that it is my duty to speak out, and to
help educate the public about what we're going to get into
if we don't stop this nonsense".
A whole generation of children has been raised with
this deceitful dogma around their necks. Have they
been encouraged or even allowed to question and explore the
science behind it? Is that likely, seeing that top scientists
have been attacked by alarmists and gagged by top journals
and disabled from gaining the peer-review and publication
they should have had? - scientists of calibre, integrity and
high ability like Tim Ball, David Denning, Willie Soon, Ferencz
Miskolczi, Will
Alexander, Zbigniew Jaworowski, Tom Segalstad, Nils-Axel
Moerner, and many more, who have been portrayed as fools,
money-grabbers, deniers of "inconvenient truth"
for selfish reasons, misrepresented on Wikipedia, collected
on blacklists, and personally attacked. So children have been
taught propaganda and lies, and have not been taken by example
through Scientific Method, that accepts nothing without checking
the evidence.
 |
Yet I can actually see
a new chapter of Science coming to birth
under the "lid" of official censorship.
The Sun in the Solar System and Galaxy promises
a lot to explore. Here is the Sun in all his glory,
seen through a whole 11-year sunspot cycle by
NASA/SOHO. Click on the picture. Enjoy it well,
for the last may be the most powerful cycle that
we will see for some time. There
are strong signs that we may have cool times ahead
- and these are far harder to cope with than warm
times. Crops fail in the shorter seasons; there
is both less sun, and less moisture, everywhere.
However, we have ingenuity and, occasionally,
wisdom, and incentive to research further. |
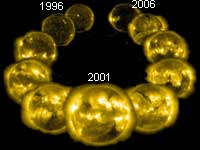
|
|
|
It often seems as if the public
are actually less fooled than those who should
know best, the experts...
What has happened in Climate Science is not unique
nor new. In the '70's the scare was that we were
going to enter an ice age...
Here is strong evidence that the ozone hole fluctuates
naturally... and, WHY IS THE OZONE HOLE AT THE
SOUTH POLE AND NOT THE NORTH POLE if we caused
it??? >>>>
|

|
|
Perhaps we can dream up some kind of amnesty
for all those unfortunate scientists and insane activists,
when they can detox, dry out, hand in their CAGW weapons without
fear of recrimination or incarceration... just appropriate
de-de-bunking post-trauma debriefing... Here's a suggested
Twelve Step Plan to Shake Off the CAGW Indoctrination
Step 1: Honesty
Tell the truth, and listen for the truth. |
Step 7: Humility
Realize that no one knows everything and that science
is still advancing. |
Step 2: Faith
Believe what can be proven. |
Step 8: Willingness
Make a list of those you convinced and set them
straight. |
Step 3: Surrender
Don’t let pride keep you from freedom. |
Step 9: Forgiveness
Forgive yourself and also forgive those who still
believe that CO2 is bad. |
Step 4: Soul Searching
Listen to the voice of reason within you. |
Step 10: Maintenance
It is OK to be wrong . Science advances by testing
hypothesis and tossing the wrong ones out the window.
You are a scientist ! |
Step 5: Integrity
Don’t allow yourself or others to advance
falsehoods unchallenged. |
Step 11: Making Contact
Stay in touch with scientific advancement and those
who also stay informed. |
Step 6: Acceptance
Don’t think you are less of a person because
you were wrong in the past. |
Step 12: Service
Help everyone around you remember that as you pursue
truth, you are also pursuing happiness |
|
One thing is very clear - There is no alarming
situation; cutting our CO2 would be cripplingly expensive
and will change nothing in the environment anyway - in fact,
the more CO2 is in the atmosphere, the better the plants will
grow. The "precautionary principle" is completely
upside-down. This scare is a distraction that adds to, rather
than solves, the real problems.
Summaries
- REAL CLIMATE SCIENCE BASICS - The Earth's
climate varies in semi-regular to irregular cycles.
- Solar output to earth = over 24,000 times our total human
output.
- There is a strongly-suspected link between the Sun, cosmic
rays, and our climate; but the science is young.
- There have been vastly greater quantities of CO2 in the
ancient past, with no ill effects.
- The greenhouse gas effect of CO2 is already saturated,
so even doubling CO2 would have near-zero effect.
- Ocean currents oscillating over decades have huge effects
on measured temperatures; the oceans' thermal inertia is
10,000 times that of the atmosphere.
- Oceans hold 49/50 of all free CO2 which outgasses in the
tropics and sinks at the poles; the total annual CO2 turnover
could be a quarter of the total atmospheric CO2 and around
40 times the human contribution.
- It is possible that the CO2 increase is from slow thermohaline
currents since the 17th Century "Little Ice Age".
- Water vapour is the biggest greenhouse gas; clouds are
the biggest natural cooler and a variable quantity.
- There appears to be a natural homeostasis mechanism that
prevents Earth temperatures going beyond certain limits.
- Plants on land, and sea animals making shells, are the
earth's well-tested natural CO2 regulators; plants account
for a third to a half of the annual CO2 turnover.
- There are serious problems with bad data, the most critical
being the "urban heat island" problem..
SCIENTIFIC METHOD IS NOT DIFFICULT TO GRASP:
it is, essentially, intelligent commonsense and persistence
in searching out and testing the laws of the Universe, consolidated
and referenced, but NOT limited, by awareness of "orthodox"
scientific knowledge. See also Ric
Werme and James Lewis
for insights into Scientific Method and the challenge of the
current situation.

|
SCIENCE EVOLVES BY UPENDING
CONSENSUS . All the really important discoveries
were once heresy. The Universe is a mystery, however
much beautiful science we clothe it in. And though
Al Gore is now up to his ears in bad science, he
once wrote an interesting book called Earth
in the Balance (just leave out the science). |

|
|
THE CHALLENGE OF CORRUPT SCIENCE IS SERIOUS.
Before Climategate, the corruption was difficult to grasp
or check, but the Climategate emails confirmed every suspicion.
Little appears to be 100% corrupt, it is much more a mixture
of group think, the glamour of "Noble Cause Corruption",
massive hubris, the funding of alarmism, and sheer bad science.
Much of the problem is at the top, where, with a new science
that has political implications, confusion has emerged between
what is natural and expected in politics, and what is legitimate,
expected, and trusted, in science. See Peiser's challenge
to the legitimacy of CAGW's claim of consensus here
AND here
AND here.
You need to read all three to see through the "disproofs
of Peiser" that are around, to see how difficult
it can be to get to the truth.
- One widespread problem has been lack of transparency,
regarding data, methods, and other issues.
- The IPCC have been less than honest, less than scientific.
There were only 52 scientists, not 2500.
- The complexification of Science, leading to specialization
and widespread ignorance, has lent itself to "divide
and rule" and the trumping of good science by grossly
inferior, atavistic science, politics, and fear-mongering.
- Models fail to handle the most powerful "forcing"
factors: water in several different forms. It is impossible
to model the climate accurately, with current knowledge.
Until we know the real climate drivers, models are nothing
but expensive, intimidating distractions and games, that
have consistently failed to predict true.
- There has been corruption
of the peer-review process and the process of publication,
that was suspected before Climategate but the emails proved.
- The media have contributed great damage to the integrity
of Science, by choosing again and again to publish alarmism
and to fail to convey a balanced account; they should be
brought to heel.
- The reins of power have been held by a small group spanning
the UN, the IPCC, certain business interests, and a few
key scientists, bloggers, activists; they have often broadcast
"don't look at us! look at the contrarians / deniers!",
used personal slurs, and avoided the science
WITHOUT WASTING ENERGY IN BLAME, THERE ARE IMPORTANT
LESSONS TO LEARN. I end with Monckton's conclusion
to his recent paper Climate Sensitivity Reconsidered;
also his concluding words to the
students at Cambridge in 2007, as lights to hold in the mysterious
realms of Science. Now here is an important observation: almost
certainly, he can see these vital principles all the more
clearly because he is NOT a degree'd scientist but has taught
himself, and because he has been motivated by passion, love
of truth, and concern for the upholding of integrity.
from
Monckton: Climate
Sensitivity Reconsidered (CAGW viability)
- Even if temperature had risen above natural
variability, the recent solar Grand Maximum
may have been chiefly responsible.
- Even if the sun were not chiefly to blame
for the past half-century’s warming, the
IPCC has not demonstrated that, since CO2 occupies
only one-ten-thousandth part more of the atmosphere
that it did in 1750, it has contributed more
than a small fraction of the warming.
- Even if carbon dioxide were chiefly responsible
for the warming that ceased in 1998 and may
not resume until 2015, the distinctive, projected
fingerprint of anthropogenic “greenhouse-gas”
warming is entirely absent from the observed
record.
- Even if the fingerprint were present, computer
models are long proven to be inherently incapable
of providing projections of the future state
of the climate that are sound enough for policymaking.
- Even if per impossibile the models could ever
become reliable, the present paper demonstrates
that it is not at all likely that the world
will warm as much as the IPCC imagines.
- Even if the world were to warm that much,
the overwhelming majority of the scientific,
peer-reviewed literature does not predict that
catastrophe would ensue.
- Even if catastrophe might ensue, even the
most drastic proposals to mitigate future climate
change by reducing emissions of carbon dioxide
would make very little difference to the climate.
- Even if mitigation were likely to be effective,
it would do more harm than good: already millions
face starvation as the dash for biofuels takes
agricultural land out of essential food production:
a warning that taking precautions, “just
in case”, can do untold harm unless there
is a sound, scientific basis for them.
- Finally, even if mitigation might do more
good than harm, adaptation as (and if) necessary
would be far more cost-effective and less likely
to be harmful.
In short, we must get the science right, or we
shall get the policy wrong... |
|
From
Monckton's conclusion to Address
to the Cambridge Union Society (key
ethical issues)
AL GORE says, “I believe this is a moral
issue.” So it is. To “announce disasters”
or “scary scenarios” or “over-represent
factual presentations” in place of adherence
to the scientific truth – that is a moral
issue.
To let politicians insert data into official
scientific documents; to alter those documents
so as to contradict scientific findings; to manipulate
decimal points so as to engender false headlines
by exaggerating tenfold – those are moral
issues.
To exaggerate by 2000% not only the atmospheric
lifetime of a trace gas but also the effect of
that gas on temperature; to reduce the magnitude
of its predicted influence on temperature without
reducing the predicted temperature itself –
those are moral issues.
To claim scientific unanimity where none exists;
to assert that catastrophe is likely when most
scientists do not; to exalt theoretical computer
models over real-world observations; to misstate
the conclusions of scientific papers or the meaning
of observed data; to overstate the likely future
course of climatic phenomena by several orders
of magnitude – those are moral issues.
To reverse the sequence of events in the early
climate; to repeat that reversal in a propaganda
book intended to infect the minds of children;
to persist in false denial that past temperatures
exceeded today’s; to state that climate
events that have not occurred have occurred; to
ascribe these non-events as well as specific extreme-weather
events unjustifiably to humankind – those
are moral issues.
To propose solutions to the non-problem of climate
change that would cost many times more than the
problem itself, if there were one; to advocate
measures to mitigate fancifully-imagined future
climatic changes when adaptation would cost far
less and achieve far more; to ignore the real
problems of resource depletion, energy security,
bad Third World government and fatal diseases
that kill millions – those are moral issues.
To advance policies congenial to the narrow,
short-term political or financial vested interest
of some mere corporation or faction at the expense
of the wider, long-term general interest of us
all – those are moral issues.
Above all, to inflict upon the nations of the
world a policy of ever-grimmer energy starvation
calculated not merely to inconvenience the prosperous
but to condemn the very poorest to remain imprisoned
in poverty forever, and to die in their tens of
millions for want of the light and heat and power
which we have long been fortunate enough to take
for granted – that is a moral issue... |
|
*****************************************
Note: 2006 Poll on "Consensus
among scientists"
| Despite claims of a “consensus”
in favor of alarmist predictions, surveys of scientists,
as well as petitions, show an extensive opposition to
alarmism. A 2003 international survey of climate scientists
(with 530 responding) found only 9.6 percent “strongly
agreed” and 25.3 percent “agreed” with
the statement “climate change is mostly the result
of anthropogenic causes.” |
A 2006 survey of scientists in the U.S.
found 41 percent disagreed that the planet’s recent
warmth “can be, in large part, attributed to human
activity,” and 71 percent disagreed that recent
hurricane activity is significantly attributable to human
activity. |
A recent review of 1,117 abstracts of scientific
journal articles on “global climate change”
found only 13 (1 percent) explicitly endorse the “consensus
view” while 34 reject or cast doubt on the view
that human activity has been the main driver of warming
over the past 50 years. |
Some References
[1] Peter Taylor, ECSR
Peter Taylor first put me on the trail of the real inconvenient
truths.
[2] Monckton of Brenchley, "35
errors in AIT" - a classic piece of the story
[3] Wm R Johnston, "Falsehoods
in Gore's An Inconvenient Truth"
[4] Prof Rossiter, "Convenient
Fibs, or Why I Flunked Al Gore"
[5] James Peden's Climate Science introduction
"The
Great Global Warming Hoax?"
[6] C Monckton, Telegraph 05/11/06,
"Climate
Chaos? Don't believe it"
[7] Monckton of Brenchley, "Gore
Gored: a science based response to Al Gore’s Global
Warming Commentary" pdf
[8] Steve Durkin, "The
Great Global Warming Swindle" video
[9] Courtney writes an interesting
history
of CAGW & Thatcher's involvement in the UK
[10] George Monbiot, The
Guardian
[11] Schmidt at RealClimate attacks
Monckton as "Cuckoo
Science"
[12] Monckton replies "Chuck
it Schmidt" including "Why the UN should apologize
for the Hockey Stick", and 16 recent science papers proving
the Medieval Warm Period
[13] Svensmark & Calder's book,
The
Chilling Stars, at Amazon with rave reviews
[14] Cosmoclimatology
in outline, Danish National Space Center
[15] eg Wikipedia, Solar
Variation Theory
[16] Journal of Atmospheric and Solar-Terrestrial
Physics, 2003 p801–812
[17] Damon
& Laut charge Svensmark with bad science he never
did (pdf)
[18] Svensmark et al, Response
to Criticism (section with several relevant papers)
[19] CBS
News, article onWikipedia Climate Science disinformation
[20] Spencer Weart, "The
Discovery of Global Warming"
[21] US senator Inhofe claims CAGW
has monumental funding advantage, $50,000 million to $19 million
[22] eg vikings in Greenland http://www.spirasolaris.ca/sbb4g1bv.html
[23] Huang and coauthors, Geophysical
Research Letters, 1997
[24] Idsos, CO2 Science, "Medieval
Warm Period"; Monckton "Chuck
it Schmidt", references at the end of this paper
[25] McKitrick, "The
hockey-stick debate" (pdf) - a classic piece of the
story
[26] Watts
Up draws attention to Beck's paper validating old CO2
records
[27] Steve McIntyre’s award-winning
science blog: pages on Proxies
and Data
quality are especially revealing
[28] Oregon
Petition Project - 31,000 US scientists who do not accept
the IPCC picture of CAGW
[29] Lawrence Solomon, environmentalist
reporter & author of "The Deniers", podcast
"the list is extremely long and the scientists are extremely
eminent, and the picture Al Gore paints is just not accurate"
[30]Climate Change 2007: The Physical
Science Basis. Contribution of Working Group to the Fourth
Assessment Report of the Intergovernmental Panel on Climate
Change, p.100, p.120
[31] eg http://www.cbc.ca/health/story/2006/05/15/polar-bears.html
[32] Article
showing there is no acidification problem - “the
system under study was surprisingly resilient to abrupt and
large pH changes” - just the opposite of what CCAGW
characteristically predicts...
[33] Nils-Axel Morne, IPCC reviewer, "Sea
level expert - it's not rising" (pdf)
[34] Glance first at Monckton's
reply to Schmidt [12],
before reading Monckton's original Nov 2006 article [6]
or Schmidt's Nov 2006 "Cuckoo Science" rebuttal
[11].
Since Monbiot had taken Schmidt's rebuttal as gospel, and
has not shifted his position despite Monckton's excellent
science refuting Schmidt's rebuttal, this particular scientific
exposition is important. Yet Schmidt has never answered Monckton's
reply, as would be expected in such a key position, if he
had had an answer to offer. In fact, Schmidt recently (July
2008) referred to his "Cuckoo Science" article as
if he had successfully disproved Monckton. Given that Monckton
had answered Schmidt's supposed disproof in 2006, point for
point, Schmidt's 2008 statement is sheer dishonesty. After
months of perusing, I've concluded that Monckton is one of
the best introductions to the refutation of the central science
issues, leaping from journalist's article to exact science
about the key issues. Just put aside Monckton's reference
to 1421, for although that too can be proved sound, it too
is currently under attack from orthodoxy, and will only create
a distraction. You don't need the 1421 reference to validate
the rest of Monckton. For more detailed maths, refer to [36]
since the Telegraph hyperlink doesn't seem to function.
[35] "Al
Gore Debates Global Warming", short U-tube video
- there are more of this kind.
[36] "Climate
Sensitivity Reconsidered", Monckton's classic 2008
expert paper on the American Physical Society Forum
[37] Skeptics'
Guide to Global Warming from Climate Skeptic
website: finally a book! This last chapter deconstructs New
Scientist's rebuttals of 20 sceptic "issues" and,
by implication, the "answers to sceptics" at Gristmill,
Skeptical Scientist, Royal Society,
[38] New Scientist's "guide for the
perplexed" list of 20
sceptics' issues "explained"
[39] Skeptical Science's main list
of 100+
sceptics' issues - each issue is discussed, then opened
for public discussion - this is the best the mainstream can
offer. Its tone has deteriorated, sadly, though the number
of issues "disproved" grows and grows.
[40] CO2
sceptics can inform you about the real nature of CO2
[41] no greenhouse effect (layman's introduction,
by a chemist with practical experience of absorption and emission
spectroscopy) "Greenhouse
Gas Facts and Fantasies" by Tom Kondis; "Heat
Stored by Greenhouse Gases" by Nasif Nahle (peer-reviewed);
and I
Love my Carbon Dioxide website of Hans Schreuder (why
greenhouse effect is false; links to several more papers)
[42] Climate Sensitivity issues brought to
US Congress by ex-NASA scientist Roy Spencer, WattsUpWithThat
[43] award-winning astronaut speaks out against
CCAGW science, WattsUpWithThat
[44] Ric Werme's excellent introduction Science,
Method, Climatology, and Forgetting the Basics
[45] Lance Endersbee 2008 "Carbon
dioxide and the oceans: Should we try harder to understand
the causes of natural climate change
instead of assuming present climate change is man-made?"
(pdf) - powerful visual evidence for ocean temp causing CO2
levels
[46] "A
2000-Year Global Temperature Reconstruction Based on Non-Treering
Proxies" - shows MWP & LIA - 2007 Craig Loehle,
with minor corrections thanks to Steve McIntyre, Gavin Schmidt,
et al
[47] NASA "Antarctic
Heating and Cooling Trends" and NASA "Two
Decades of Temperature Change in Antarctica". Now
although In
It for the Gold says that Connolley suggested that the
first picture is "probably the work of a PR droid",
we suspect bias all round.
[48] WattsUpWithThat
- Scroll down to 11.38am post on 4/8/08 by Josh
[49] Josh Hall explains the use of graphs
for "Causality
Inference in Dynamic Systems"
[50] Joe d'Aleo, US
Temperatures and Climate Factors since 1895 pdf
[51] Dr Vincent Gray, "Spinning
the Climate" and "Comments
on the Recent Statement by the Climate Committee of the Royal
Society of New Zealand" - these pages are unique,
to my knowledge, for adequately conveying the IPCC workings,
the weakness of their science claims, and their serial downplaying
of natural factors (this is clear by the IPCC chapter headings),
in a lively, readable way. But Dr Gray's latest "Global
Warming Scam" is badly written, with foolish assertions
that do not help make his science credible. There are better
sceptics' writings on the issues he covers here. However,
here
(read both letters), he sets out pretty clear, straightforward
evidence against CAGW's basic claims.
[52] Dr
John Everett, IPCC impacts analyst, "Climate
Change Facts"
[53] Prof Tom Segalstad "On
the construction of a greenhouse effect global warming dogma"
[54] Robinson, Robinson & Soon "Environmental
effects of increased atmospheric CO2" pdf
[55] Usoskin & Solanki "Millennium-Scale
Sunspot Number Reconstruction: Evidence for an Unusually Active
Sun since the 1940s" pdf
[56] John McLean,"Peer
review? What peer review? Failures of scrutiny in the UN's
Fourth Assessment Report" pdf
[57] Lockwood and Frohlich, Recent
oppositely directed trends in solar climate forcings and the
global mean surface air temperature is a rebuttal of the
recent solar warming underpinning Svensmark - but it's rebutted
in turn by "A
Critique on the Lockwood/Frohlich Paper in the Royal Society
proceedings" by Ken Gregory, and by Svensmark
and Friis-Christensen. Read all!
[58] William Kininmonth, "Unmasking
AIT" pdf
[59] Prof. David F. Noble, "Opposing
Views on Global Warming: The Corporate Climate Coup"
[60] Beck, "180
Years of atmospheric CO2 Gas Analysis by Chemical Methods"
2007. Download from this page to read the paper, the telling
comment by Keeling junior, and Beck's reply
|
Glossary
of Acronyms and Abbreviations
| ppm |
parts per million by volume |
Gt |
gigatonnes weight (=1,000,000,000 tonnes) |
| CAGW |
Catastrophic Anthropogenic Global
Warming |
IPCC |
Intergovernmental Panel for
Climate Change |
| AGW |
Anthropogenic Global Warming |
CO2 |
Carbon Dioxide (the chemical formula) |
| GHG |
Greenhouse Gas |
AIT |
An Inconvenient Truth (Al Gore's
film) |
| MWP |
Medieval Warm Period |
|
|
|
|
I've tried to give credits
where appropriate, however if I've not acknowledged you properly,
please let me know and I'll put in the credits or remove the
reference. If anyone has serious queries with my material,
I would be glad to be given the chance to respond in kind,
before being dismissed in places where I’ve had no chance
to respond.
key page - updated 15th February 2011 |
|


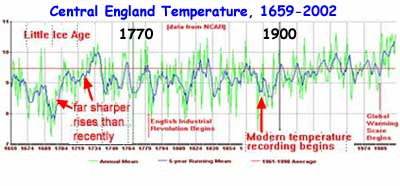
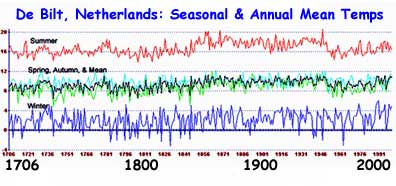
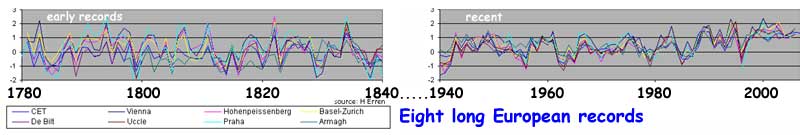

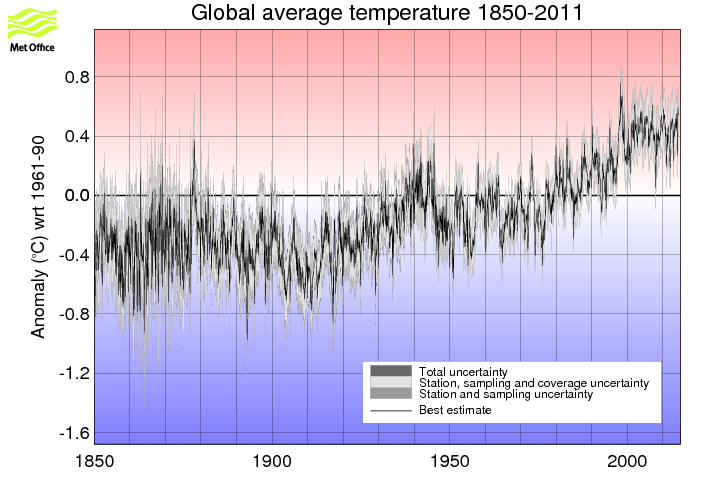

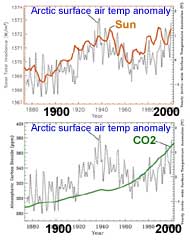
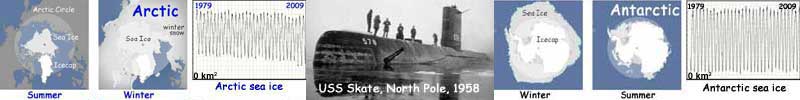
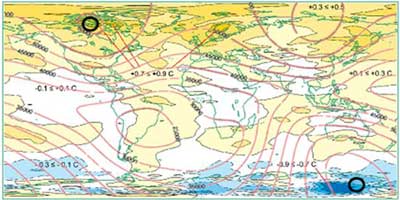


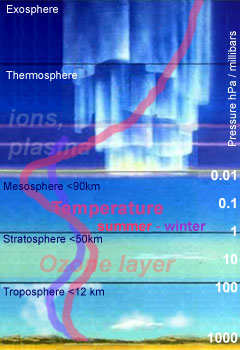
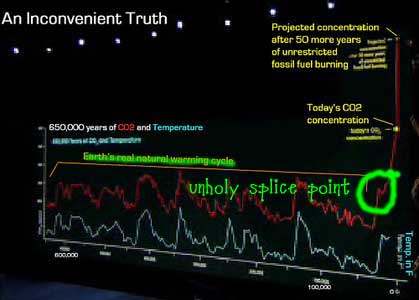


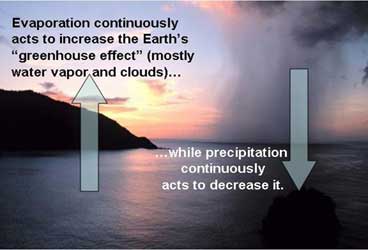
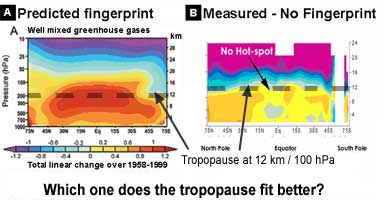
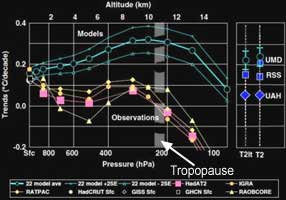


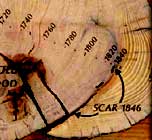


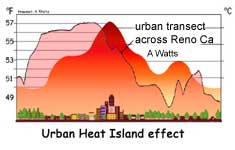


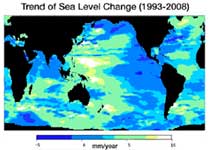

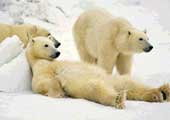


